
Revised 25 July 2023
Accepted 31 August 2023
Available Online 25 September 2023
- DOI
- https://doi.org/10.55060/j.jseas.230925.001
- Keywords
- Automated driving
STPA
Functional safety
FMEA
HD maps
Unsafe control actions
CARLA - Abstract
The increasing progress of Automated Driving (AD) technologies emphasises the significance of maps in ensuring the safety of these AD systems. While research has been conducted on the safety of AD systems themselves, the role of maps has not been thoroughly explored. In this article, we aim to address this gap by conducting an analysis to quantify the impact of maps on the functional safety of AD systems. We employ System Theoretic Process Analysis (STPA) to study an SAE Level 2 automated driving vehicle that relies on maps. Through this approach, we estimate and identify various unsafe scenarios that may arise due to map data. Furthermore, we conduct simulations using CARLA to measure the influence of safety-critical map features (identified based on the outcomes of STPA). To account for uncertainties in these safety-critical map features, we introduce a Gaussian noise signal into the model. To evaluate the vehicle’s safety, we establish Key Performance Indicators and record their values across various test cases. Through this research, we successfully identified unsafe scenarios along with their corresponding map features. Leveraging simulations, we also showcased the admissible error margins in the map for the selected map feature, ensuring the secure operation of an AD system.
- Copyright
- © 2023 Eindhoven University of Technology. Published by Athena International Publishing B.V.
- Open Access
- This is an open access article distributed under the CC BY-NC 4.0 license (https://creativecommons.org/licenses/by-nc/4.0/).
1. INTRODUCTION
The swift progress of technology has brought about a change in the degree of automation in vehicles. The automotive sector has transitioned its attention from conventional manually operated vehicles to the automation of driving functions, commencing with driver-assist systems and advancing towards fully Automated Vehicles (AV) [1]. The widespread release of such automated driving systems emphasizes the necessity of evaluating and guaranteeing the safety and dependability of in-vehicle systems.
Besides their advantages, AV do bring multiple challenges that must be dealt with. There is a lack of appropriate infrastructure needed to run autonomous vehicles [2]. The performance of such advanced systems depends on maps being readily available. Maps as a sensor provide priory knowledge sources for an AV and can play a key role in the capabilities and performance of the vehicles. ADAS systems such as adaptive cruise control use the map feature about “speed limit” data to ensure the vehicle not only maintains a specified distance concerning the vehicle ahead but also a set speed.
Furthermore, traffic signs and incoming road curvature are also provided to the driver thus enabling better vehicle performance. Another application of maps for an AV is providing geofencing information such that an OEM can specify the Operational Design Domain (ODD) based on their vehicle’s capabilities and testing results [3]. Maps are provided to vehicles by various map vendors such as TomTom [4]. Since these systems are heavily reliant on navigation data, minor lapses in accuracy could have severe consequences [5].
Conventional safety analysis techniques such as Failure Mode and Effects Analysis (FMEA) and System Hazard Analysis (SHA) yield scenarios of failure in physical components [6,7,8]. The system is modified to prevent the occurrence of such scenarios [9]. Physical testing of the prototype in these scenarios aids in the validation of its performance [10]. However, some scenarios go unnoticed during conventional safety analysis, resulting in an unexpected failure. FMEA, Fault tree analysis (FTA) and SHA are based on reliability theory and are designed to prevent component failure accidents [11]. Conventional safety analysis methods revolve around the failure of system hardware. A new method, System Theoretic Process Analysis (STPA), has been proposed for conducting a thorough analysis of software-driven control systems [12]. By using STPA, a different point of view on a system’s existing safety analysis outcomes can be obtained. Furthermore, the results can be used to improve the system’s existing overall safety.
Recent studies have been performed with the purpose of analyzing the safety of automated vehicles [13]. Currently, high definition maps are being utilized by multiple vehicle manufacturers for enabling different levels of autonomous driving [14]. However, in any of the studies, the role of these maps in the safety of automated driving has not been investigated. This article aims to bridge this gap by performing an analysis from a mapmakers’ point of view. This enables mapmakers to develop a clearer picture of the impact maps can have on the safety of the AD systems [15].
This article consists of four sections. Section 2 contains a brief introduction to STPA and the selected self-driving simulator, CARLA. Section 3 explains the application of STPA and CARLA to the given problem statement. Section 4 shows the results of application of the defined methodology to the problem statement. This is followed by Section 5 in which the findings are discussed. Section 6 presents the conclusions which are drawn from the findings in the previous section.
2. BACKGROUND INFORMATION
This section provides a detailed introduction to the selected safety analysis technique, System Theoretic Process Analysis (STPA). This is followed by a discussion of different self-driving simulators available, which is used in the selection of a simulator for the given application. The various features of the selected simulation environment, which are used in this study, are presented.
2.1. System Theoretic Process Analysis
System Theoretic Process Analysis (STPA) is a hazard analysis technique based on an extended model of accident causation [12]. In addition to the failure of components, STPA works under the assumption that accidents can be caused by unsafe interactions of system components, none of which may have failed. In the STPA framework, a system will not enter a hazardous state unless an unsafe control action has been performed by the controller. The steps performed in the STPA approach are represented in Fig. 1.
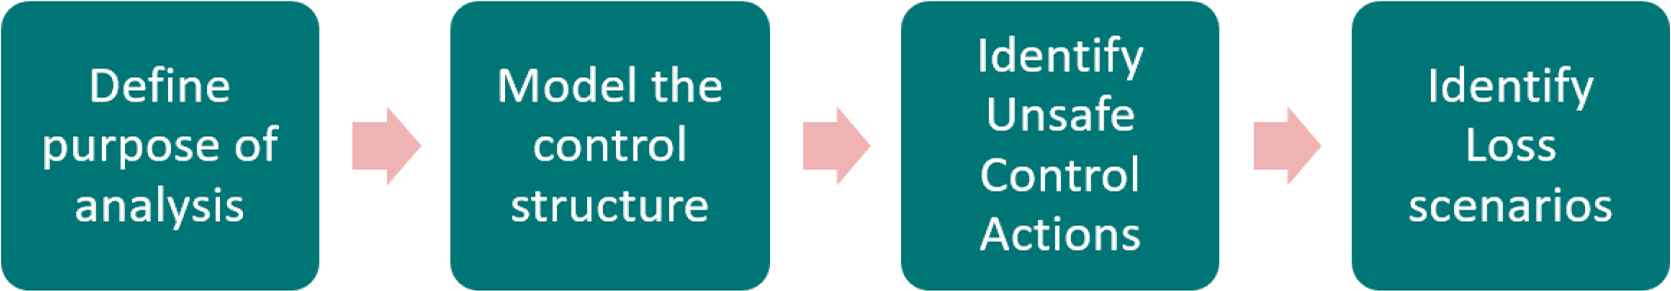
Steps undertaken in STPA.
There are four steps which are performed in STPA [12]:
- 1.
Define the purpose of the analysis: STPA is performed on a system for a specific purpose and requires a clear definition of the purpose and scope to ensure appropriate results [12]. The system under analysis must be defined by identifying the elements subject to analysis. The analysis scope pertains to the system under investigation. It is important to define the system by specifying its boundaries, interactions with other systems, and the environment.
- 2.
Model the control structures: The second step of the analysis consists of modeling control structures which are used for identifying control actions, unsafe control actions and controller constraints. A hierarchical control structure is a top-down system model that is composed of feedback control loops [12,16].
- 3.
Identify unsafe control actions: The listing of control actions is followed by the identification of unsafe control actions (UCAs). A UCA is a control action that, in a particular context and worst-case environment, will lead to a hazard [12].
- 4.
Identify loss scenarios: Loss scenarios describe the situation that can lead to UCAs and to hazards [12]. The two types of scenarios which are identified in this step are:
- (a)
Why would UCAs occur?
- (b)
Why would control actions be improperly executed or not executed, leading to hazards?
- (a)
2.2. Selection of Autonomous Driving Simulator
A highly reliable autonomous driving vehicle requires testing of autonomous characteristics in every possible scenario. The design, implementation and testing of vehicles are not only costly but also time-consuming, in a wide range of use cases, in realistic traffic and weather conditions. Replicating a given worst-case environment or condition to test an autonomous driving vehicle is a challenging task. A suitable solution for autonomous driving software testing is a virtual platform in the form of an autonomous driving simulator [15].
An autonomous driving simulator is used for testing an autonomous vehicle within a defined virtual environment [17,18]. Key Performance Indicators are used to compare the performance of the vehicle in different scenarios. To select an appropriate simulator, criteria for evaluation were drawn as follows:
- 1.
License mode
- 2.
Operating system
- 3.
Customization of simulation environment/world
- 4.
Setup and execution time for simulation
- 5.
Customization of control strategies
- 6.
Production of videos/simulation quality
Simulators were reviewed by TomTom based on a set of hard and soft requirements [19]. Hard requirements are associated with providing simulation data, ROS interfacing, performance on currently utilized hardware, and lastly a physical model of the vehicle and the world. Soft requirements are related to the quality of the vehicle, the world, weather and daytime simulation, usability, and collision detection and avoidance. Due to the overlap with respect to the criteria drawn above, the results of this review were integrated in this article.
Simulators that were reviewed by TomTom are CARLA [20], Gazebo [21], Airsim [22], DeepDrive [23], Udacity Self-Driving car simulator [24], GTA V [25], AutonoVi [26], CarSim [27], IPG Carmaker [28], aiSim [29], VTD [30], PreScan [31], Webots [32] and LG Simulator [33]. The majority of the mentioned simulators are commercially available whose licenses are not owned either by TomTom or TU/e, and thus are out of consideration. Simulators that were selected for the given application are the following:
- 1.
CARLA
- 2.
Webots
- 3.
LGVSL
Based on the defined criteria for evaluation, we selected CARLA as the base autonomous driving simulator used for the given tests.
3. METHODOLOGY
In this section, the methodology applied to the given system is presented. The application of STPA for a given system is presented below. This is followed by the description of the tasks performed in CARLA, which includes the processes involved in conducting tests and gathering information for post-processing.
3.1. System Theoretic Process Analysis of Automated Driving
The process described in the previous section was applied to the automated driving system. The level of automated driving selected was 2 as per SAE [34]. STPA was conducted from the point of view of map-makers. The losses of the different stakeholders were identified and used for listing system-level hazards. The second step of the analysis was performed by modeling control structures for the system. The control actions were identified from the respective control structures [16]. Following their identification, they were categorized based on their dependence on the map or automated driving system with an impetus given either to the former or a combination of the two categories. The third step consisted of identifying UCAs for the automated driving system. Criteria were applied to the list of control actions to yield UCAs. The UCAs concerning map features were the primary focus.
The last step of the analysis was the identification of loss scenarios. Loss scenarios were identified based on the UCAs identified in the previous step. Each scenario was categorized based on its severity and probability of exposure [35]. Severity was assigned a value from 1 to 3 with 1 being the least severe and 3 being the most. A similar approach was followed for probability of exposure. The product of the severity and probability of exposure was used to assign a priority to each scenario. The different levels of priority that were taken into consideration have been described in Table 1.
| Level of Priority | Product of S and E |
|---|---|
| Low priority | 1 |
| Medium priority | 2, 3, 4, 6 |
| Highest priority | 9 |
Levels of priority based on product of severity (S) and probability of exposure (E).
To understand the context, entities and the different triggers present in the scenario, a root cause analysis of the high-priority scenarios was performed [36]. Furthermore, the map feature and its respective Key Performance Indicators which would be required by the vehicle in each scenario, to prevent the occurrence of a hazard, were identified. This marked the end of the safety analysis.
3.2. Validation of Loss Scenarios
Loss scenarios were the output of STPA, which was followed by their prioritization based on the severity and probability of exposure. The priorities assigned for different scenarios were validated using two sources of data. The first source of information was obtained from TomTom’s clients. They utilize TomTom’s high-definition (HD) maps in their L2 AD systems. The second set of scenarios was obtained using TomTom’s measurement data. Measurement data is collected using TomTom’s Mobile Mapping (MoMa) vehicles. They are mounted with different sensors which collect data used for making HD maps. Since these vehicles are driven on different types of road classes, the use cases sourced from the data were considered to be ground truth.
The three sets of use cases were brought together to form a pool of scenarios. Scenarios are validated by either finding a match between the two lists or by finding commonality in the description of the scenarios. A form of commonality could be the common map features between the different sets of scenarios. If two scenarios were leading to a common hazard or were caused due to a common map feature, the loss scenario could be considered to be validated. This process yielded a final list of validated loss scenarios, which is highlighted in Fig. 2.
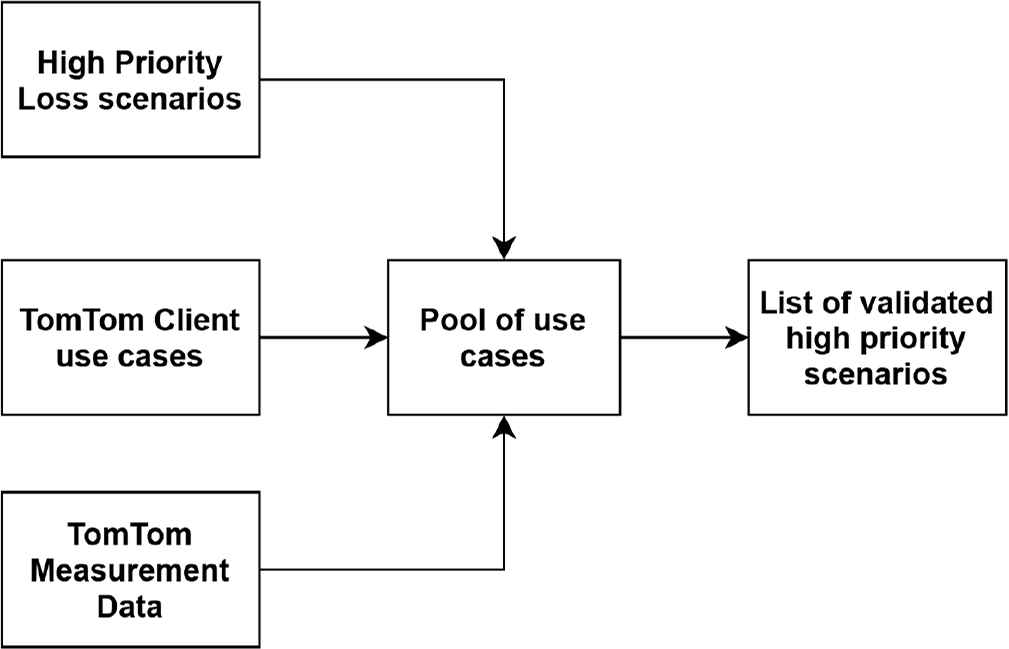
Steps undertaken in the validation of unsafe scenarios.
3.3. Simulation of Map Uncertainty
Safety critical features of the map were determined by classifying the features required in each high-priority scenario. Simulations concerning the accuracy of this feature in a worst-case environment were conducted by injecting noise into it. The simulations were conducted using CARLA [37].
In a simulation environment, a map is a replica of the physical world. When a map is built using ground truth data, errors will be generated whilst replicating those features in a model. Errors in the map could play a fundamental role in the decision-making process for the vehicle due to their dependence on map data. The simulations primarily concern the impact of these errors on the vehicle’s lateral control.
For the given application in CARLA, pre-defined OpenDrive files provided in the build were used [38]. This was used for the generation of the waypoints which can be considered equivalent to the lane geometry feature in TomTom’s HD map. The set of waypoints generated was also used in route generation. Gaussian noise signals were injected into them to emulate a map which was made using ground truth data. The bias and jitter of the noise signal were estimated based on the range of accuracies of the HD map produced by TomTom [39]. The process is highlighted in Fig. 3. A vehicle model was selected from the Blueprint library in a parallel manner, which was prepared for simulation. The process of noise injection into CARLA is illustrated in Fig. 4.
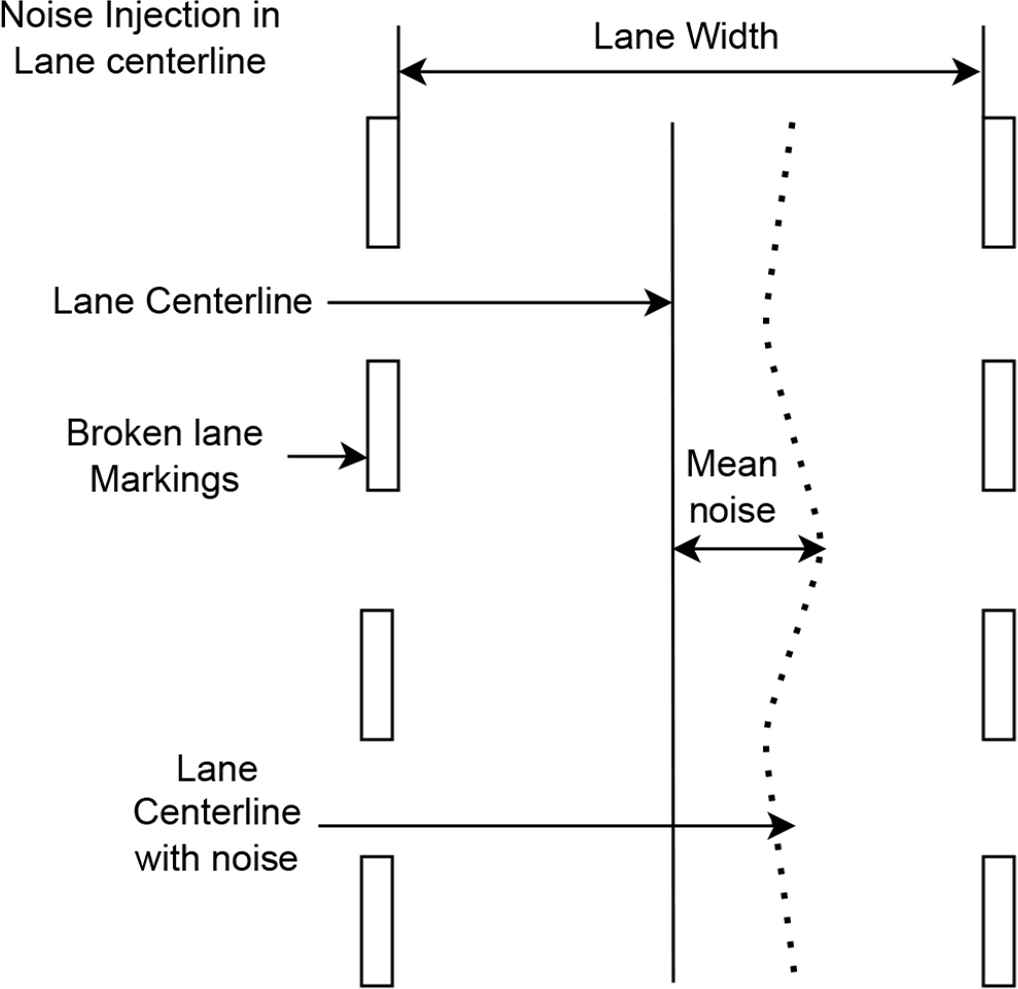
Top view of noise injected in waypoints.
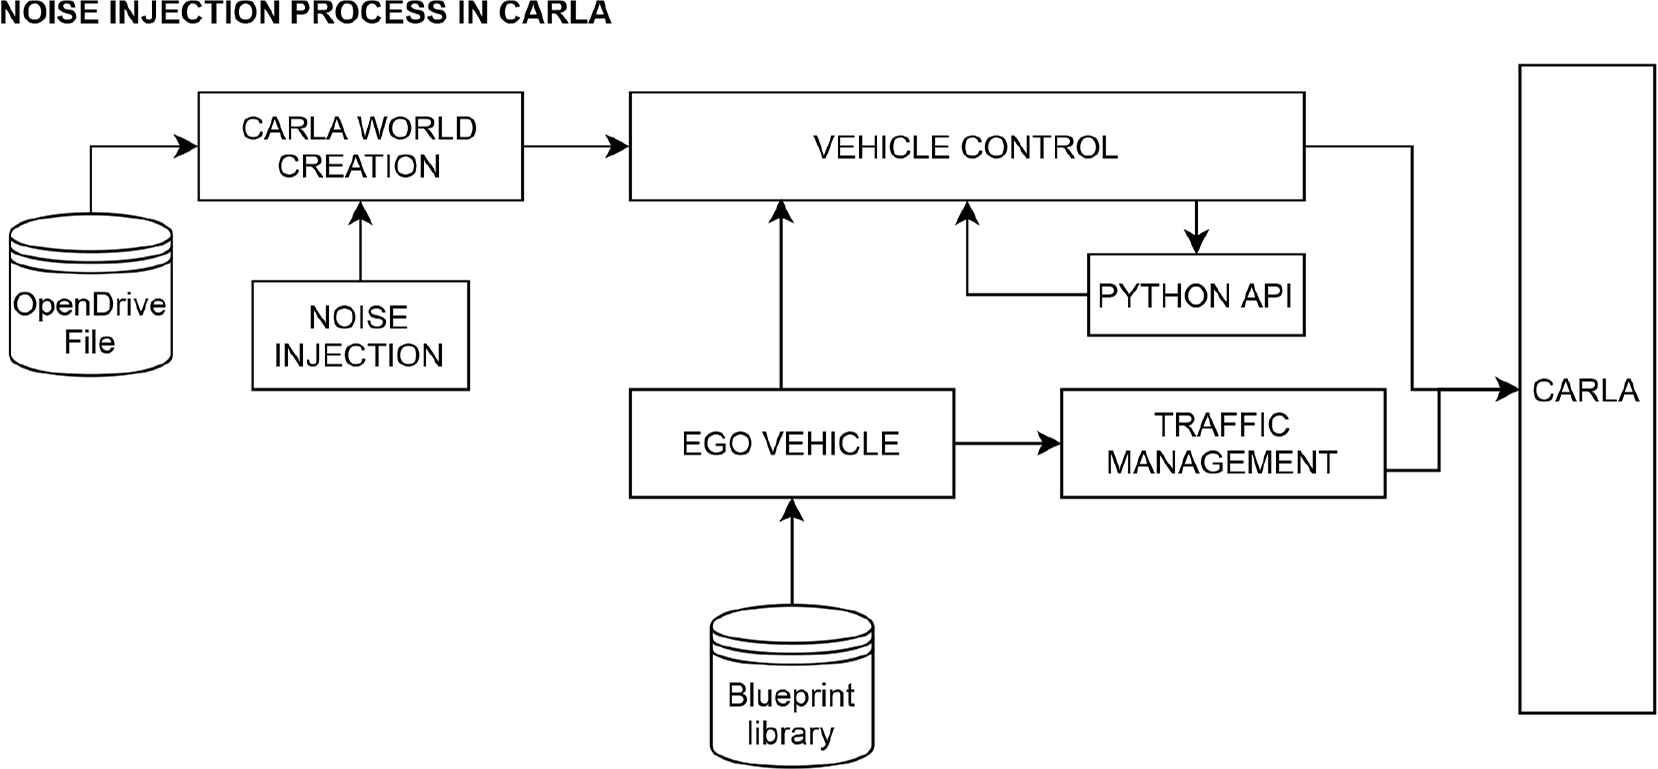
Noise injection into the CARLA simulator.
The simulation of vehicles required the definition of assumptions to limit the scope of simulation to those use cases concerning the usage of maps. The set of assumptions defined are as follows [15]:
- 1.
Vehicle is operating/driving in automated driving mode.
- 2.
Vehicle is reliant only on GPS, IMU and map data for manoeuvring a given route.
- 3.
The vehicle has perfect localization, minimal errors in the positional estimate made by the GPS and IMU.
- 4.
Camera and LiDAR have been disabled to portray a worst-case environment for the vehicle’s automated driving (AD) system.
Key Performance Indicators (KPIs) were defined for evaluating each case’s severity. In a given worst-case state, the vehicle can be considered to be in a safe state if it follows the system-generated path with the least error and does not exit its occupied lane. The KPIs are presented in Fig. 5. Using this information, three KPIs are defined which are as follows:
Calculation of Key Performance Indicators (KPIs) for the simulation.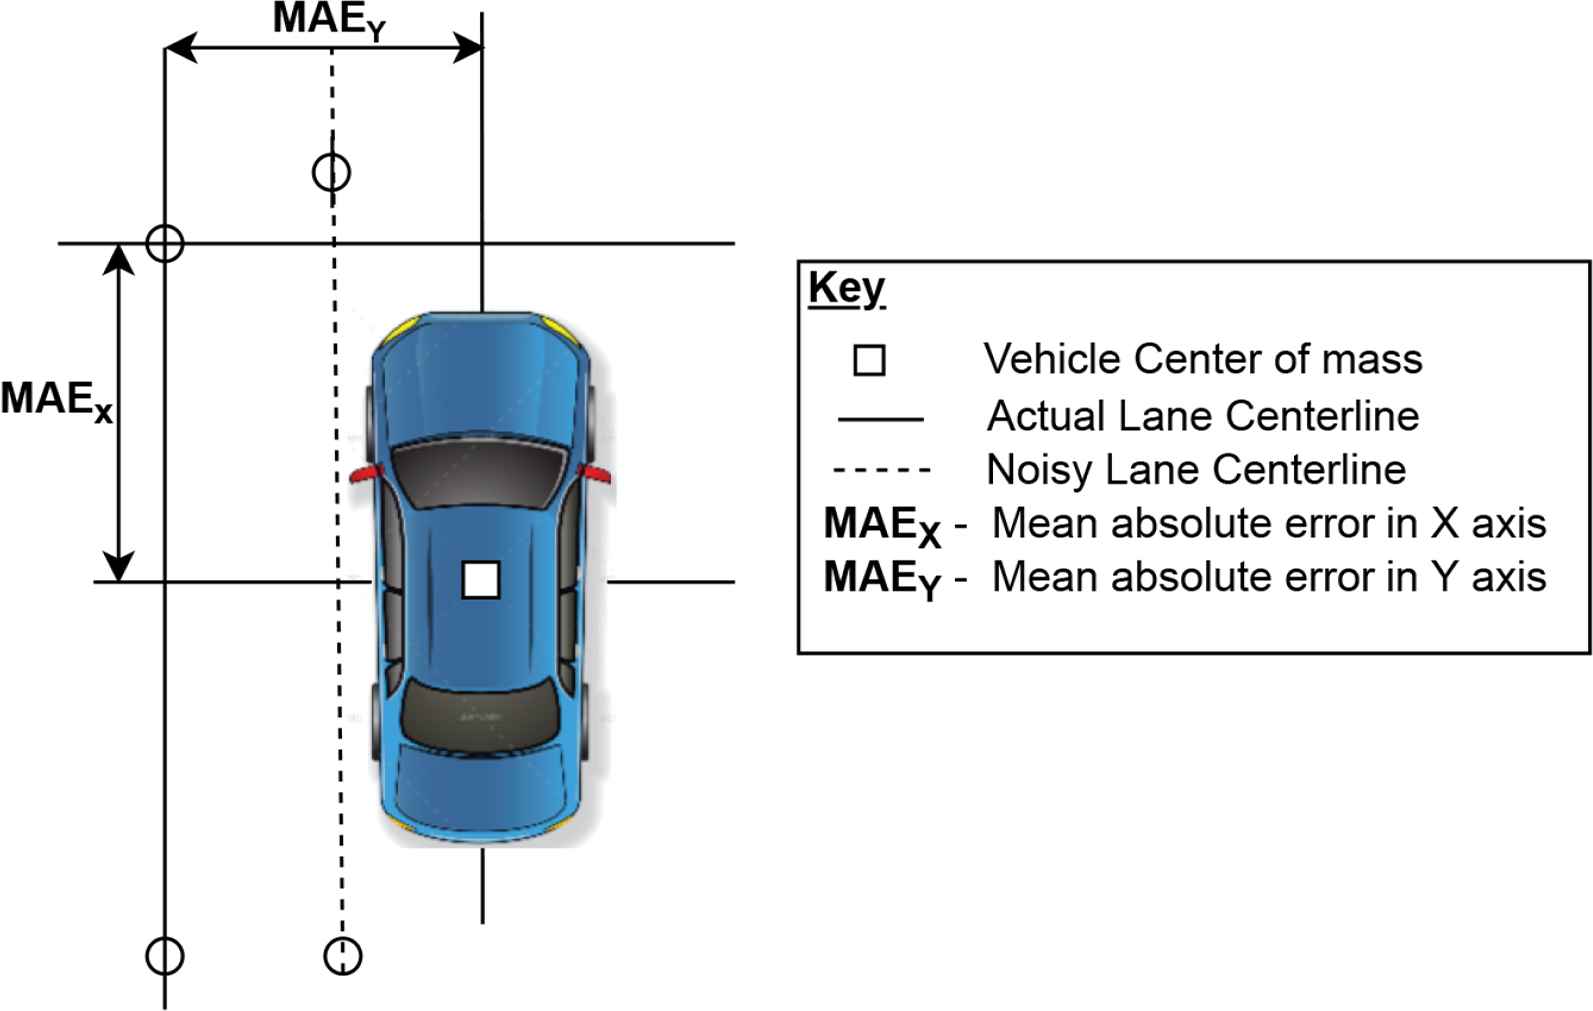
- 1.
Mean absolute error (MAE):
The error generated in tracking a path, which has an element of bias introduced in it. The error is estimated by taking the average of the difference of the vehicle’s location with respect to the original route (bias = 0).
- 2.
Sensitivity:
Sensitivity refers to the change of mean absolute error with respect to the change in mean noise injected into the map feature.
- 3.
Lane invasions:
Refers to the number of occasions the vehicle cuts a lane. The function prints the number of times the vehicle cuts a given lane and the type of lane it cuts into. This parameter was used to compare performance of the vehicle in difference cases of bias. Furthermore, the positions at which lanes are cut by the vehicle are also observed.
4. RESULTS AND DISCUSSIONS
The above-mentioned methodology is applied to the given Level 2 Autonomous driving system. The results of the vehicle-level safety analysis and CARLA simulator are presented in this section.
4.1. Vehicle-Level Safety Analysis
Stakeholders of the analysis were identified from the problem context. This was followed by listing out the goals of each stakeholder, which were then inverted to formulate eleven losses. The goals of the map providers were closely associated with the HD map, thus their losses are related to the quality of the map. The list of losses identified for the map providers are as follows:
- 1.
Loss in the completeness of maps
- 2.
Loss in positional accuracy of maps
- 3.
Loss in thematic accuracy of maps
- 4.
Loss in logical consistency of maps
System-level hazards were identified using the system-level states. Each hazard was traced back to the loss it causes. A subset of the hazards, H2 and H3, has been presented in Table 2. The hazards presented were traced to the losses presented above.
| Hazard ID | Hazard Definition |
|---|---|
| H2 | The vehicle engages autonomous mode in restricted areas of the map. |
| H3 | The AV follows the wrong trajectory. |
List of hazards of Level 2 autonomous driving system.
Control structures were modeled to appropriately represent the system. The high-level (HL) control structure of automated driving vehicle using maps has been presented in Fig. 6. Modeled control structures were used for listing out control actions. The control actions were used as a base for identifying UCAs. Impetus was laid on identifying UCAs for those control actions which were filtered using the categorization process discussed in Section 3.1.
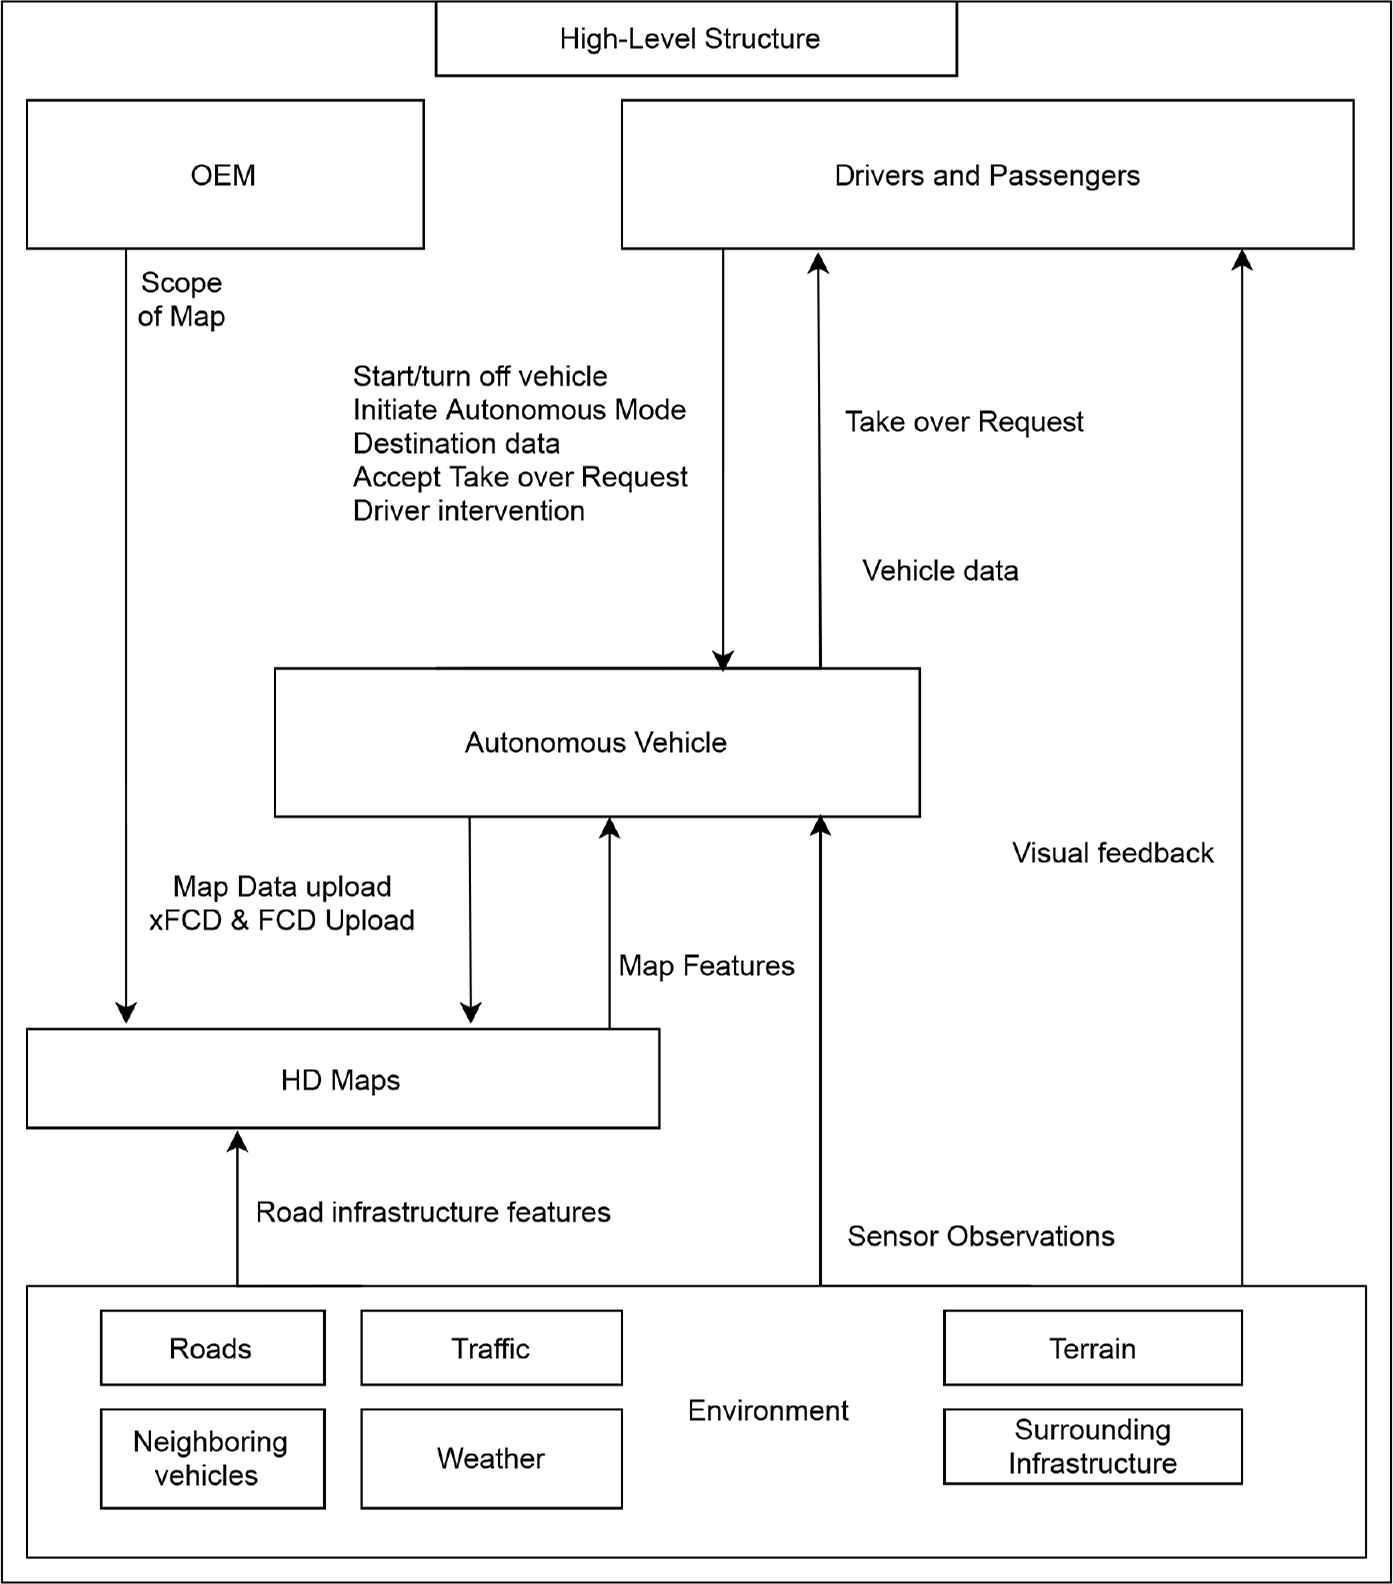
HL control structure of AV using maps.
Loss scenarios were established through the utilization of the Uncontrollable Adverse Events (UCAs) listing. An illustration of one such scenario, LS 4, is presented in Fig. 7. The vehicle in automated driving mode (AM) approaches a road with missing lane markings. The inability to provide lane information results in the localization system’s failure to estimate the vehicle’s lateral position with respect to the lane markings. As a result, the vehicle loses its lateral tracking momentarily. To track the path further, the vehicle must rely on the map data to drive to a location where the control can safely be handed over to the driver. If the vehicle receives inaccurate lane centerline information, the vehicle would cause a hazard such as H3, highlighted in Table 2.
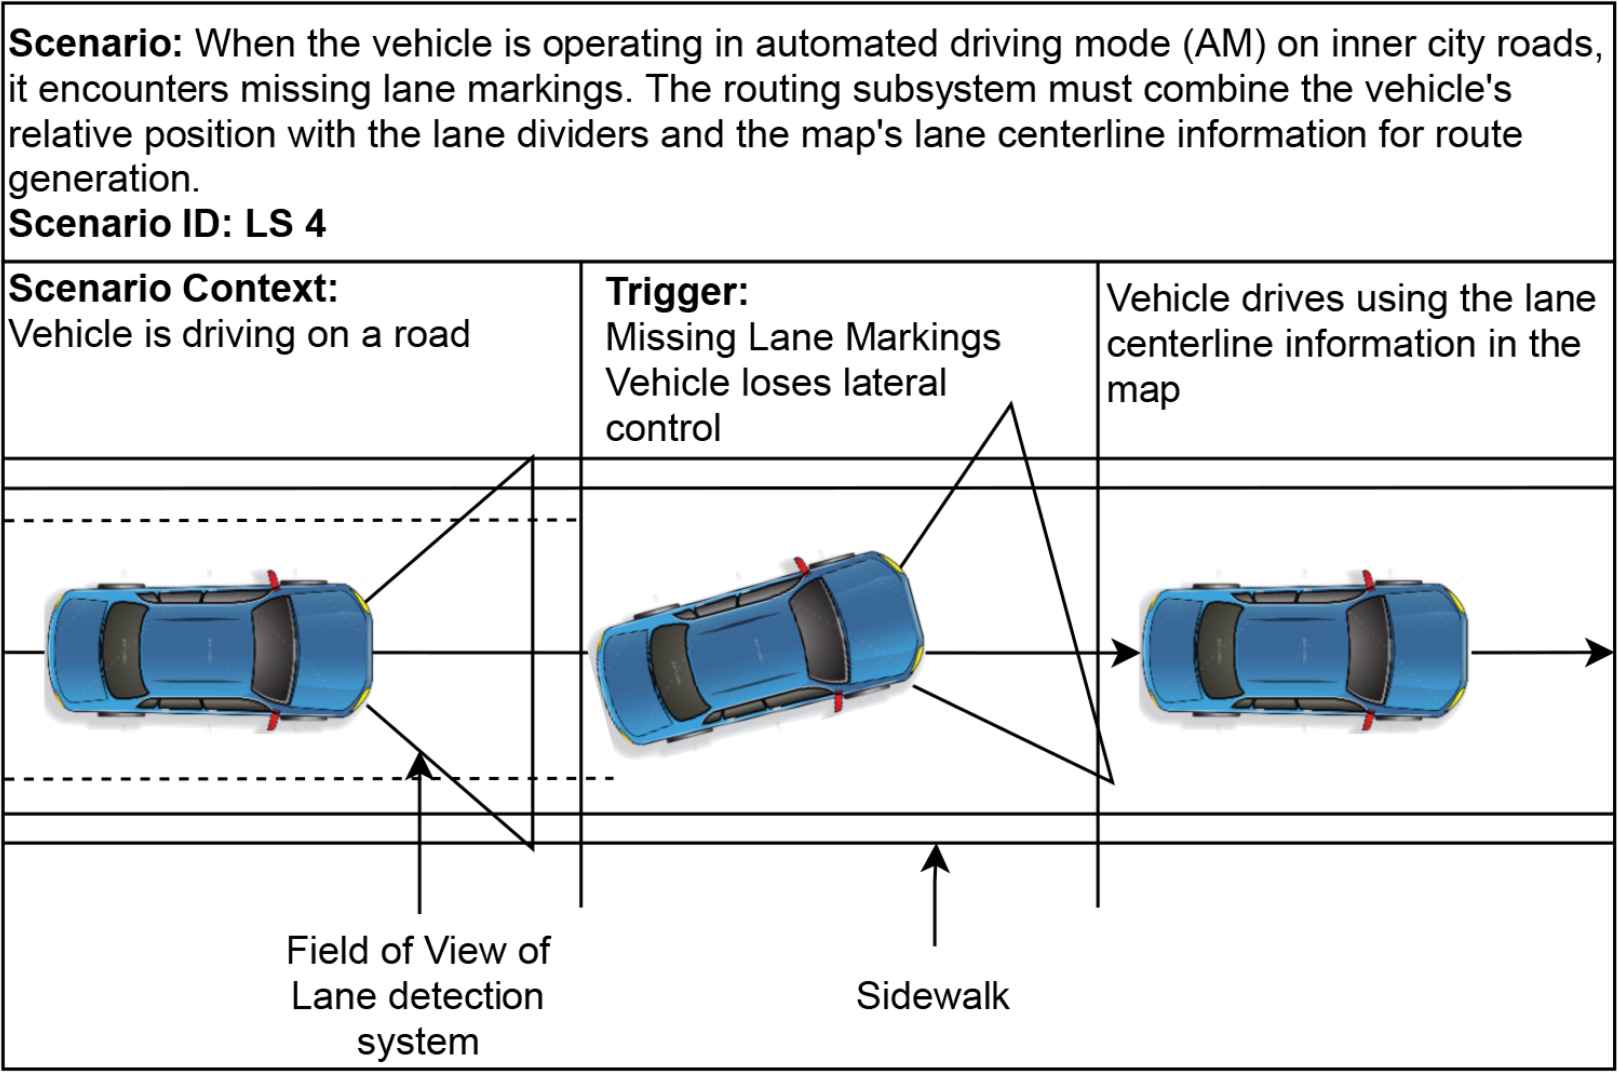
Loss scenario concerning missing lane markings on the road.
Each listed scenario was ranked based on the process mentioned in Section 3.1. The ranking of scenarios yielded high-priority scenarios. These were further categorized based on the map feature needed in the defined scenario. The breakdown of the scenarios with respect to the features is as follows:
- 1.
Lane features
- 2.
Traffic signs
- 3.
Speed restrictions
- 4.
Overhead structures
This concludes the results of the safety analysis. The results of the validation of loss scenarios are presented in the next subsection.
4.2. Loss Scenario Validation
Scenario validation was performed to ensure that the loss scenarios relevant to the problem were appropriately identified. The process of validation began by pooling the scenarios obtained from STPA, TomTom’s clients and TomTom’s measurement data. 17 scenarios were identified using STPA. 32 scenarios were identified using TomTom’s client and measurement data. The validation of a scenario from STPA has been demonstrated below.
The loss scenario presented in Fig. 7, LS 4, was validated using a use case from TomTom’s clients and MoMa. STPA yields a loss scenario wherein the vehicle encounters missing lane markings on inner city roads. TomTom’s client has identified a use case for its L2 AD system wherein the AV encounters a road stretch with no visible lane markings. MoMa surveys containing camera data indicated missing lane markings for given road stretches during its operations. Since each of the sources identifies the same root cause, missing lane markings, the scenario from STPA was considered to be validated.
Following the validation of scenarios, we can conclude the validation of loss scenarios. The next set of sections present the results obtained from performing simulations in the CARLA simulator.
4.3. CARLA Simulator Results
The results obtained by performing different tests using the CARLA simulator have been presented in this section. The focus of the tests conducted in the CARLA simulator were lane centerlines, which were represented with the help of waypoints. Different vehicles were selected for performing the simulations in CARLA. The parameters which were taken into consideration whilst performing simulations in CARLA are presented in Table 3.
| Parameters | Range of Values |
|---|---|
| Type of noise | Gaussian |
| Bias (mean noise) | [–0.60, 0.60] meters |
| Jitter (standard deviation) | [0, 0.20] meters |
| Curvature of road | [0, 100] meters |
| Speed of vehicle | 30 kmph |
| Sampling size | [0.15, 2.5] meters |
List of parameters considered in simulations.
The range of bias and jitter injected into the waypoints are varied from Table 3. The range of bias and jitter was selected based on the quality levels set by TomTom for their products. To emulate inner city/urban road simulations, the speed of the vehicle was limited to 30 kmph.
A Gaussian signal, comprising of bias and jitter, was injected into the lane centerlines. The magnitude of the bias and jitter was varied based on Table 3. Two cases were considered in this test. The vehicle was driven on a straight road and on a path with a defined radius of curvature. The radius of curvature selected for this application was 102 meters. The KPIs were measured for the latter case and are presented in Fig. 8.
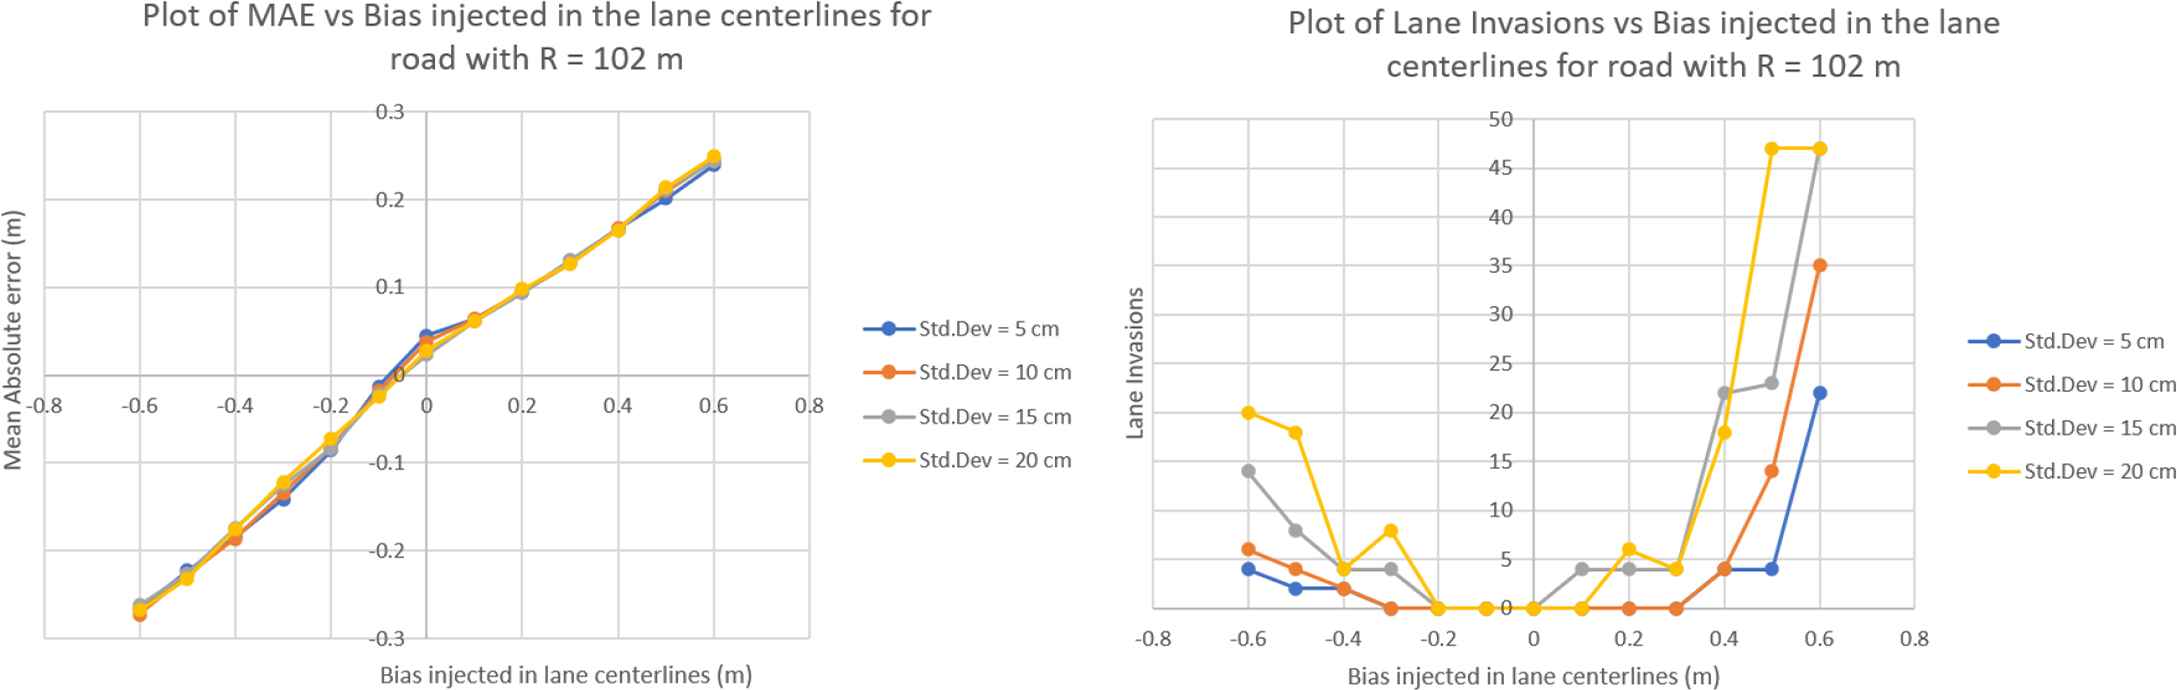
Plot of Mean Absolute Error (left) and Lane Invasions (right) vs Bias injected into lane centerlines (m) for R = 102 m.
We observed that the MAE increased with the increase in the bias of the Gaussian signal in Fig. 8. Lane invasions increased at higher orders of bias. A jitter of 20 cm resulted in maximum MAE and lane invasions in the second case.
Similar behavior of MAE and lane invasions was observed when the vehicle drove on a straight road.
5. DISCUSSION
In this section, the results obtained from performing the methodology are presented. First, the results obtained from the safety analysis will be discussed, followed by the simulation on map uncertainty conducted in CARLA.
5.1. Safety Analysis
The safety analysis was performed from the point of view of map manufacturers, to understand the usage of maps by an AV system. Stakeholders were identified and their respective losses were listed. Hazards were identified at a system level. A dependency between the identified hazards was established. An instance of the dependency has been shown with the hazards H2 and H3. The occurrence of hazard H3 led to the occurrence of hazards H2. Thus, the triggering of multiple hazards from a single hazard was identified from this analysis.
In the safety analysis, control structures were modeled for the AV system, which yielded control actions. CA were filtered using a categorization process. The filtered CAs were used for identifying UCAs. UCAs were filtered based on their dependency on map features, and the remaining UCAs were used in listing out unsafe scenarios. This process yielded a large pool of loss scenarios. The process of scenario prioritization was applied to the pool of scenarios which led to a concise list of high-priority scenarios.
The root cause analysis labeled 60% of the high-priority scenarios as unavoidable. This meant that the scenarios identified were out of control for the driver and could cause a hazard. In a worst-case scenario, the safety of the AV could be ensured by placing a higher confidence level in the map data as compared to sensor data. Higher confidence levels in maps could be complemented with the aid of regular updates and quality checks. If inaccurate map data was provided in such scenarios, it could compound the existing scenario. This was observed in LS 4. The dependency of the vehicle’s lateral control on the quality of the map using CARLA has been demonstrated and has been discussed in the upcoming section.
5.2. CARLA Simulation Findings
Simulations were conducted on AD vehicles in CARLA. KPIs were defined and used in the evaluation of the impact of different parameters on the vehicle’s performance. The bias and jitter varied in each simulation. The impact of uncertainty in the map was observed in two scenarios. The scenarios which were tested are the AV was driven on a straight road and then on a road with a defined radius of curvature [15].
By conducting various tests on different scenarios, it was observed that the amount of bias added to the lane centerlines had a linear relationship with the mean absolute error (MAE) of the vehicle. However, the same impact was not observed with jitter. This linear relationship can be attributed to the vehicle tracking a path with added noise. As the noise-injected path was consistently at a varying distance from the original centerline, the vehicle’s localization estimate shifted by that specific distance with respect to the original centerline.
Lane invasions exhibited a non-linear relationship with bias. Higher magnitudes of jitter in the noise signal led to higher lane invasions. This resulted in the vehicle following a wavy path, which resulted in more lane invasions being recorded. Lower magnitudes of jitter when coupled with higher magnitudes of bias led to many lane invasions due to the vehicle positioning itself close to the extremities of the lane borders.
We observed the role of map uncertainty on the vehicle’s performance. The lateral positioning of the vehicle was evaluated using the mean absolute error, while different noise signals were added to the route being tracked. Additionally, we monitored lane invasions to determine whether the vehicle was able to remain within its designated lane. Multiple lane invasions posed a risk to other vehicles on the road, so this was used as an indicator of the safety of the noise added to the map.
6. CONCLUSION
The impact of maps on the functional safety of an automated driving vehicle using maps was observed by performing two tasks: the safety analysis and the simulation of map uncertainty in a self-driving simulation environment. The safety analysis was aimed at identifying scenarios in which an AD system could encounter a hazard despite performing its functions as per specification, thus putting the vehicle at risk. Simulations were performed to visualize the impact of the uncertainty on the lateral control of the vehicle coupled with the failure of the camera.
In the safety analysis, loss scenarios were identified for the AD system which occurred due to unsafe interaction of system components. Loss scenarios occurred despite the optimal functioning of system components, thus justifying the selection of the safety analysis technique. Lane and traffic signs and speed restrictions were classified as high-priority safety-relevant map features. The analysis also yielded unsafe scenarios occurring due to incorrect map data. Furthermore, these scenarios were encountered despite optimal vehicle sensor feedback, which meant that the L2 AD system would encounter the identified hazards in its operational state. Hence, from the analysis performed, we can conclude that an approach solely based on sensors would not be sufficient to guarantee the system’s safety.
Simulations were conducted in a self-driving environment to assess the impact of map uncertainty and camera failure on the vehicle’s lateral performance. Two Key Performance Indicators (KPIs) were used to estimate the lateral performance. The results from these tests indicate that a vehicle can navigate a given path with minimal sensor and map data. However, the success of this approach heavily relies on the quality and accuracy of the map data. Noise in the map data does affect the lateral control of an autonomous vehicle (AV), and while it can never be completely eliminated, its magnitude can be reduced through rigorous quality checks during the map production process. Nonetheless, from the perspective of producing maps of such high accuracy may incur costs that outweigh the benefits gained in terms of lateral performance. Therefore, finding a balance between production costs, map accuracy requirements and the capabilities of the map production system is crucial.
Considering both the safety analysis and simulations, it is evident that an L2 AD system cannot ensure the safe functioning of the vehicle using solely sensor or map data. However, fusing data from both sources can enhance the AD system’s ability to guarantee safety in both its operational and fail-degraded states. AD system developers and mapmakers must collaborate on a unified safety concept to ensure the overall safety of the vehicle.
Finally, the scope of this paper was limited to conducting System Theoretic Process Analysis (STPA) on an SAE Level 2 automated driving vehicle using maps.
Conflict of Interest
The authors declare no conflicts of interest. Note that because the third author of this article is one of the Editors-in-Chief of the journal, the peer review process has been managed without any involvement from this Editor-in-Chief.
Data Availability
The data that support the findings of this study are available from the corresponding author upon reasonable request.
Funding
The authors declare no funding was used for this study.
Authors’ Contribution
Vishwanath N. Pai contributed to study conceptualization, system implementation, testing and writing (review & editing) the manuscript. Ion Barosan and Arash K. Saberi supervised the project, state-of-the-art research and writing (review & editing) the manuscript.
REFERENCES
Cite This Article
TY  - JOUR
AU  - Vishwanath Nagnath Pai
AU  - Ion Barosan
AU  - Arash Khabbaz Saberi
PY  - 2023
DA  - 2023/09/25
TI  - Map and Its Impact on the Functional Safety of Automated Driving Vehicles
JO  - Journal of Software Engineering for Autonomous Systems
SP  - 17
EP  - 27
VL  - 1
IS  - 1-2
SN  - 2949-9372
UR  - https://doi.org/10.55060/j.jseas.230925.001
DO  - https://doi.org/10.55060/j.jseas.230925.001
ID  - Pai 2023
ER  -


