
Email: vasilii.mosin@volvocars.com
Email: darko.durisic@volvocars.com
Email: miroslaw.staron@cse.gu.se
Revised 30 August 2023
Accepted 21 September 2023
Available Online 18 October 2023
- DOI
- https://doi.org/10.55060/j.jseas.231018.001
- Keywords
- ML-based system
Development process
Deep learning
Case study - Abstract
Automotive software uses new Machine Learning (ML) algorithms in increased number of systems, including active safety ones. However, with this new paradigm, new challenges arise in the domain of safety-critical automotive software. This article reports on a case study of the development of ML-based vision perception systems at one vehicle Original Equipment Manufacturer (OEM). We investigate how image-intensive perception systems are developed, both from the perspective of ML development processes and automotive software development processes. We conducted interviews with four engineers who were involved in the development process and subsequently performed thematic coding to extract key findings. We focus on how the teams are involved in the process of assuring the production quality of the Society of Automotive Engineers (SAE) level 3 functionality in modern passenger cars. We examine how the ML development process phases (e.g., data collection, model training, and model validation) align with the automotive software development phases (prototype development, software development, validation, deployment). The study found that the development process for ML-based vision perception systems in active safety allows for flexibility to adapt to changes in data collection, and integrates ML model development into the software development process. The investigated approach combines the Agile SAFe model, ML-model development, and the standard automotive V-process model. This study shows an example of combining these development processes using an industrial case study and presents the essential alignment points between different phases of these processes. The study also recommends best practices for developing similar systems in other companies.
- Copyright
- © 2023 Chalmers University of Technology. Published by Athena International Publishing B.V.
- Open Access
- This is an open access article distributed under the CC BY-NC 4.0 license (https://creativecommons.org/licenses/by-nc/4.0/).
1. INTRODUCTION
Automotive software uses machine learning (ML) algorithms in increasingly more functions, including active safety ones. Although the ML algorithms provide benefits of being able to adapt to new situations and generalize from the previous data, they also introduce new challenges [1]. One of these challenges is alignment of the structured automotive software development with its strict testing and validations phases with the iterative nature of the process of training-testing-validation of ML models. Another challenge is the fact that data collection has become an integral part of the automotive software development process [2].
Traditionally, the automotive software development followed the V-shaped process model, which was focused on the development of hardware, electronics and software in different stages. Recently, the automotive development processes migrated towards agile software development – often following SAFe (Scaled S.K. Pandey et al. / Journal of Software Engineering for Autonomous Systems / In Press, Uncorrected Proof Agile Framework) [3] or A-SPICE (Automotive Spice) [4]. ML-based software development, on the other hand, follows a data science approach, with focus on iterative model training and validation [5,6,7]. The problem of aligning the two processes is even more evident in the development of systems that are somewhat evolution to previous functions – e.g. using a new kind of camera in low-speed maneuvering.
In the development of modern vehicles, with ML components, these two processes need to be aligned as data collection and model development require several feedback loops before the software is ready for deployment. Software development (and product development) teams need to understand how to combine the iterative machine learning model development with the iterative development of the automotive software at large. In particular, they need to follow specific guidelines on handling the collected data (image data); the collected data are generally used to train and evaluate the ML model. These guidelines also ensure the quality of the collected data and the quality of the entire system under development. At the same time, ML engineers need to understand the software requirements for planning data collection activities before the models are architectured, trained and validated. Software requirements provide a clear roadmap for data collection. They specify the needed data (images) types, sources, and quality criteria. These requirements guide data collection efforts (e.g., driving scenarios), ensuring that the collected data aligns with the project’s objectives and the needs of the machine learning models. Even seemingly routine tasks such as splitting data into training, testing, and validation sets must be carefully pre-planned. The data collection process can be time-consuming and resource-intensive, ensuring the accuracy of ML models [8] depends on the quality and correctness of the data.
Previously, this problem has been approached from either the data science perspective or from the perspective of software development. From the data science perspective, Rassõlkin et al. [9] studied creation and collection of data for autonomous vehicles (AV), finding that the data collection and formatting are of crucial importance. Divya et al. [10] has recently proposed a list of instructions and guidelines for data collection for AVs. From the automotive software development perspective, Jo et al. [11,12] provided guidelines for design and development of distributed systems of autonomous vehicles, including the ML components.
Currently, combining these two processes is a challenge. This becomes clearer as companies work on developing systems in this area. Merging software engineering with machine learning lacks a standard approach, and it is affected by activities such as how systems are released and managed over time. For example, when existing systems in the market need updates, the OEM must figure out how to collect data and train algorithms to match the system’s changing needs.
Therefore, we set off to study how these two processes are combined by practitioners – or how professional software development organizations address this problem. We designed and conducted a case study at one of the vehicle OEMs. We interviewed engineers/developer/testers involved in the development of image-intensive perception systems for autonomous vehicles with level 3 SAE functionality1. To analyze the data obtained from the interviews, we performed thematic coding [13], which enabled us to extract pertinent findings.
We investigated how the development teams assure the production quality of the Society of Automotive Engineers (SAE) level 3 functionality in modern vehicles by addressing the following research questions (RQs):
- 1.
What are the best practices when combining machine learning model development with automotive software development? – which we studied to understand how the company has integrated both processes.
- 2.
How do practitioners plan, execute and evaluate image data collection in automotive software development? – which we studied to understand the data collection process and its quality evaluation.
- 3.
How do practitioners define and measure test/ train/validation data split to assure production quality of the entire system? – which we studied to understand how the data was split into training, validation, and testing sets; including the process of securing such properties as data distribution and preventing data leaks.
- 4.
What characterizes a good architecture of the ML model for such systems? – which we studied to understand how the model architecture is defined, and how the model was trained and validated. We operationalized it in two sub-questions: How do practitioners define the training process? and How do practitioners quantify the model’s performance in training, testing, and validation?
We conducted a case study of the development of one function called “low-speed maneuvering” (LSM) using fisheye cameras. This function required such dedicated cameras to be specifically used in scenarios where vehicles move slowly. According to our current knowledge, this function is the first of its kind in the automotive industry. The challenge of this development is that image recognition, object detection and semantic segmentations have not been studied or developed for this type of camera. Although a large extent of image recognition had been done before at the company, these new types of cameras provide images that have non-isotropic properties and therefore new models and new algorithms need to be provided. These new models, in turn, require new data and new data collection procedures from the field, annotations and quality assurance. We further identified that the model development phase is time-consuming and should consider primary attention from the development team. Additionally, our investigation revealed the alignment between the SAFe automotive development process and fits with the machine learning development process.
The outcomes of our case study make a valuable contribution by showcasing the practical combination of the software development workflow for autonomous systems and the ML workflow. Our comprehensive analysis of various phases across both workflows has provided valuable insights into the interdependencies and overlap of phases inherent in the development of the LSM. Our study has revealed how these two processes have been aligned and how software development teams have collaborated with data collection teams to plan, execute and assess data collection activities meticulously. We have observed that the data collection phase is carefully planned while allowing for some flexibility to accommodate all possible scenarios. Additionally, we have discovered that several phases entail a feedback loop to ensure the delivery of a high-quality product consistent with the classical development process of an autonomous system.
The next section will discuss the related work. Further, we explore the study context and results in Section 3 and 4, respectively. Finally, we illustrate our key findings, limitations, and conclude our work in Section 5–7, respectively.
2. RELATED WORK
This section provides an overview of the latest work based on data handling and production quality analysis in autonomous vehicles.
The use of autonomous vehicles (AVs) in transportation has become an active area of research in recent years. Manivasakan et al. [14] conducted a case study on AV infrastructure requirements, formulating infrastructure change guidelines and prioritizing various safety, efficiency, and accessibility concerns in AVs. Their work provides a multi-model user comparison between autonomous and conventional vehicles in Australia. Jing et al. [15] conducted a survey study on AVs and found that knowledge about AVs and perceived risk are the two main potential obstacles for travelers to use AVs and semi-AVs. However, unlike these studies, our work emphasizes interviews based on the design of an intelligent infrastructure system in AVs, focusing solely on data handling.
Several studies have explored the optimization of ML algorithms for AVs. Kim et al. [16] presented an industrial case study on developing deep neural network (DNN)-based object segmentation, which was found to be effective in improving the performance of ML-based AVs. They exploited the correlation between surprise adequacy and model performance, which enables the understanding of model performance and data collection and helps to identify how much further training is required. This work provides valuable insights into optimizing the performance of ML algorithms used in AVs. Fagnant et al. [17] proposed an agent-based model for shared AVs and found that they have the potential to replace traditional vehicles while adding up to 10% more travel distance. Although this work does not directly focus on developing ML-based perception systems for AVs, it highlights the potential benefits and challenges associated with the widespread adoption of AVs.
Our work builds on these studies by examining the ML workflow for AVs by conducting interviews with experts. The ML workflow consists of data collection, model training, and model validation. The training and evaluation phases of the ML workflow are computationally intensive [18], whereas the data collection and labeling are manual labor-intensive [19]. Therefore, our work investigates the data handling process in the ML workflow by interviewing engineers who were part of the development process and focuses on how the teams involved in the process assure the production quality of the SAE level 3 functionality in modern passenger cars.
In recent years, several works have been proposed to develop building blocks for end-to-end AVs. One such work proposed by Pranav et al. [20] is a real-time pedestrian detection system that employs a convolutional neural network (CNN) [21]. The authors used public datasets and evaluated the performance of the proposed model in real-time video input. The model was compared with baseline methods and produced an accuracy between 96.73% to 100%.
Li et al. [22] developed a human-like driving system (decision-making system) for AVs to minimize the gap between human drivers and the self-driving system. They also used CNN, and the proposed model can detect, recognize, and abstract the given road input. The model calculates specific commands to regulate the vehicles.
Other recent works, such as lane detection [23,24,25], real-time pedestrian detection [26,27,28], and driving assistance systems [29,30,31,32,33], have also contributed to the development of high-quality image segmentation systems in AVs.
Although our present work mainly focuses on interviews to develop an intensive image system for ensuring product quality, these related works provide a solid foundation for building autonomous driving systems that can detect and respond to road situations in real-time.
3. STUDY CONTEXT & RESEARCH DESIGN
Adaptive cruise control, auto parking, or parking assist systems allow a certain degree of autonomous driving – driver assistance. These features require an enormous amount of data of the right diversity to either train an ML/DL model or to validate the traditional control-loop algorithm. The studied OEM collects a massive amount of data to develop such features. In this case study, we focus on low-speed maneuvering functionality based on dedicated camera images. The data is collected in the form of sequences of images by driving in different geographical locations, weather conditions, and the time of the day.
Our study employs a qualitative interview approach to address our research inquiries and investigate perceptions and experiences in developing image-intensive autonomous drive systems. We have followed the Empirical Standard of the ACM SIGSOFT (tinyurl.com/ QualitativeSurveys). The demographic information of all the interviewees is shown in Table 1. Here, interviewees E1 to E3 are responsible for the development process, whereas E4 is associated with the testing team.
| S. No | Designation | Experience (Years) | Responsibilities |
|---|---|---|---|
| E1 | Data Scientist | ≥20 |
|
| E2 | Senior Developer | ≥10 |
|
| E3 | Senior Developer | N/A | N/A |
| E4 | Technical Expert testing of active safety function | ≥20 |
|
Demographic details. Note: We do not have the demographic information of E3 as they are no longer part of this study.
Sampling. The sampling technique used here was based on selecting the experts who had the most experience with this type of development, based on our previous studies [34]. Table 1 shows the list of four interviewees, who were part of this study. The table also reports the designation, and year of experience. The last column states the responsibilities of the interviewee in the function development.
Data Collection. The data collection process involved conducting a series of interviews with participants. The interview questions asked were designed to facilitate the framing of research questions. It is important to note that sub-questions are not included in this summary. The interview questions and their mapping with research questions are presented in Table 2 to provide a comprehensive overview of the data collection process.
| Interview Questions | Research Questions |
|---|---|
| Q-1. What is basis for data collection for function development? | RQ-1, RQ-2 |
| Q-2. What is the basis for choosing a specific model architecture for specific function? | RQ-1, RQ-4 |
| Q-3. How is the data splitting defined and performed? | RQ-1, RQ-3 |
| Q-4. How are KPI for model performance constructed and monitored? | RQ-1, RQ-3 |
| Q-5. How is the training process defined and performed? | RQ-1, RQ-3 |
| Q-6. How is the validation process defined and performed? | RQ-1, RQ-2 |
| Q-7. How is the production model finalized? | All |
| Q-8. Are the any mechanisms to control the quality of the data during the run-time? | All |
Mapping of interview questions to research questions.
Pre-Testing. Each interview was recorded and then transcribed. The transcriptions were shared between the research team members, while the recordings were kept at the company promises, being accessed only by the interviewer (as per consent with the interviewees). After transcribing the interviews, thematic coding was conducted by one of the authors, following established methods [13,35]. The resulting codes and themes were shared with the other authors, and a case study was then performed based on the coded data.
Data Analysis. The collected data were qualitative; therefore, we used thematic analysis as a data analysis method [36]. We used a mixed form of coding, where we started with several high-level codes based on our RQs, then refined and adapted these codes when going through the transcripts [37].
4. RESULTS
In order to provide the context to the results, first we provide qualitative codes to provide the overview, then we start by presenting how the automotive software development and the ML model development are combined in the studied organization. Then, we present the answers to the four research questions in our study, as discussed in Section 1.
4.1. Overview: Thematic Coding
Our analytical process involved identifying six high levels thematic codes based on the data gathered from the interviews conducted during the development of the LSM, as illustrated in Fig. 1. These high-level codes are 1) Requirements: Defining the specific functionalities and objectives of the low-speed maneuvering function using fisheye cameras in automotive scenarios. It includes data, owner, function, and KPI requirements. 2) Data Preparation: Collecting and curating relevant fisheye camera images and corresponding object detection annotations for training and evaluation. 3) Preprocessing: Developing and implementing algorithmic components to process fisheye camera images, feature distribution, and data splitting. 4) Deployment: Integrating the developing function into the automotive system, considering safety checks, quality assurance, and simulation. 5) Model Architecture: Designing and selecting different architecture also includes training. 6) Performance Evaluation and Fine-Tuning: Assessing the function’s effectiveness through KPIs and iteratively refining the algorithm based on evaluation outcomes. It includes manual analysis, KPI discussion, testing & validation, and hyperparameter tuning. The figure presents an overview of these codes. These high-level codes are further divided into sub-codes. For instance, Preprocessing code is divided into Feature distribution , Data splitting , and Feature selection , depicted in purple boxes. Notably, we observed that these high-level codes align with the different phases of the classical ML workflow, as depicted in Fig. 2.
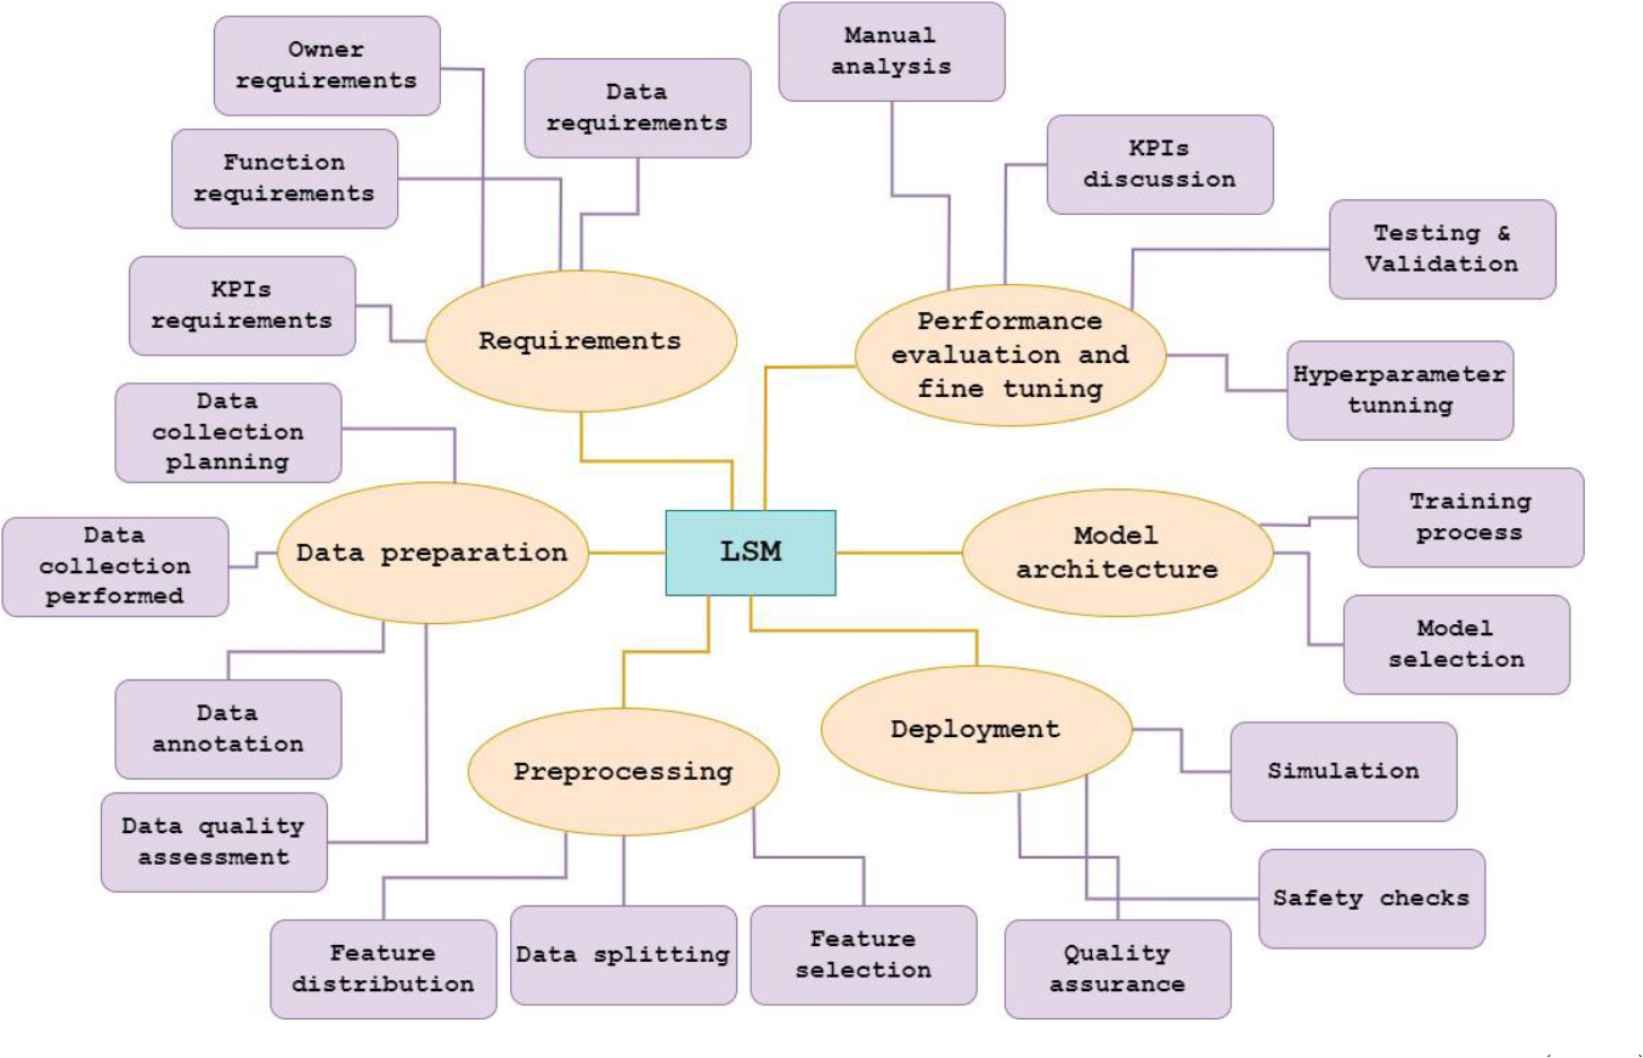
Overview of the thematic codes used for the development of low-speed maneuvering (LSM).
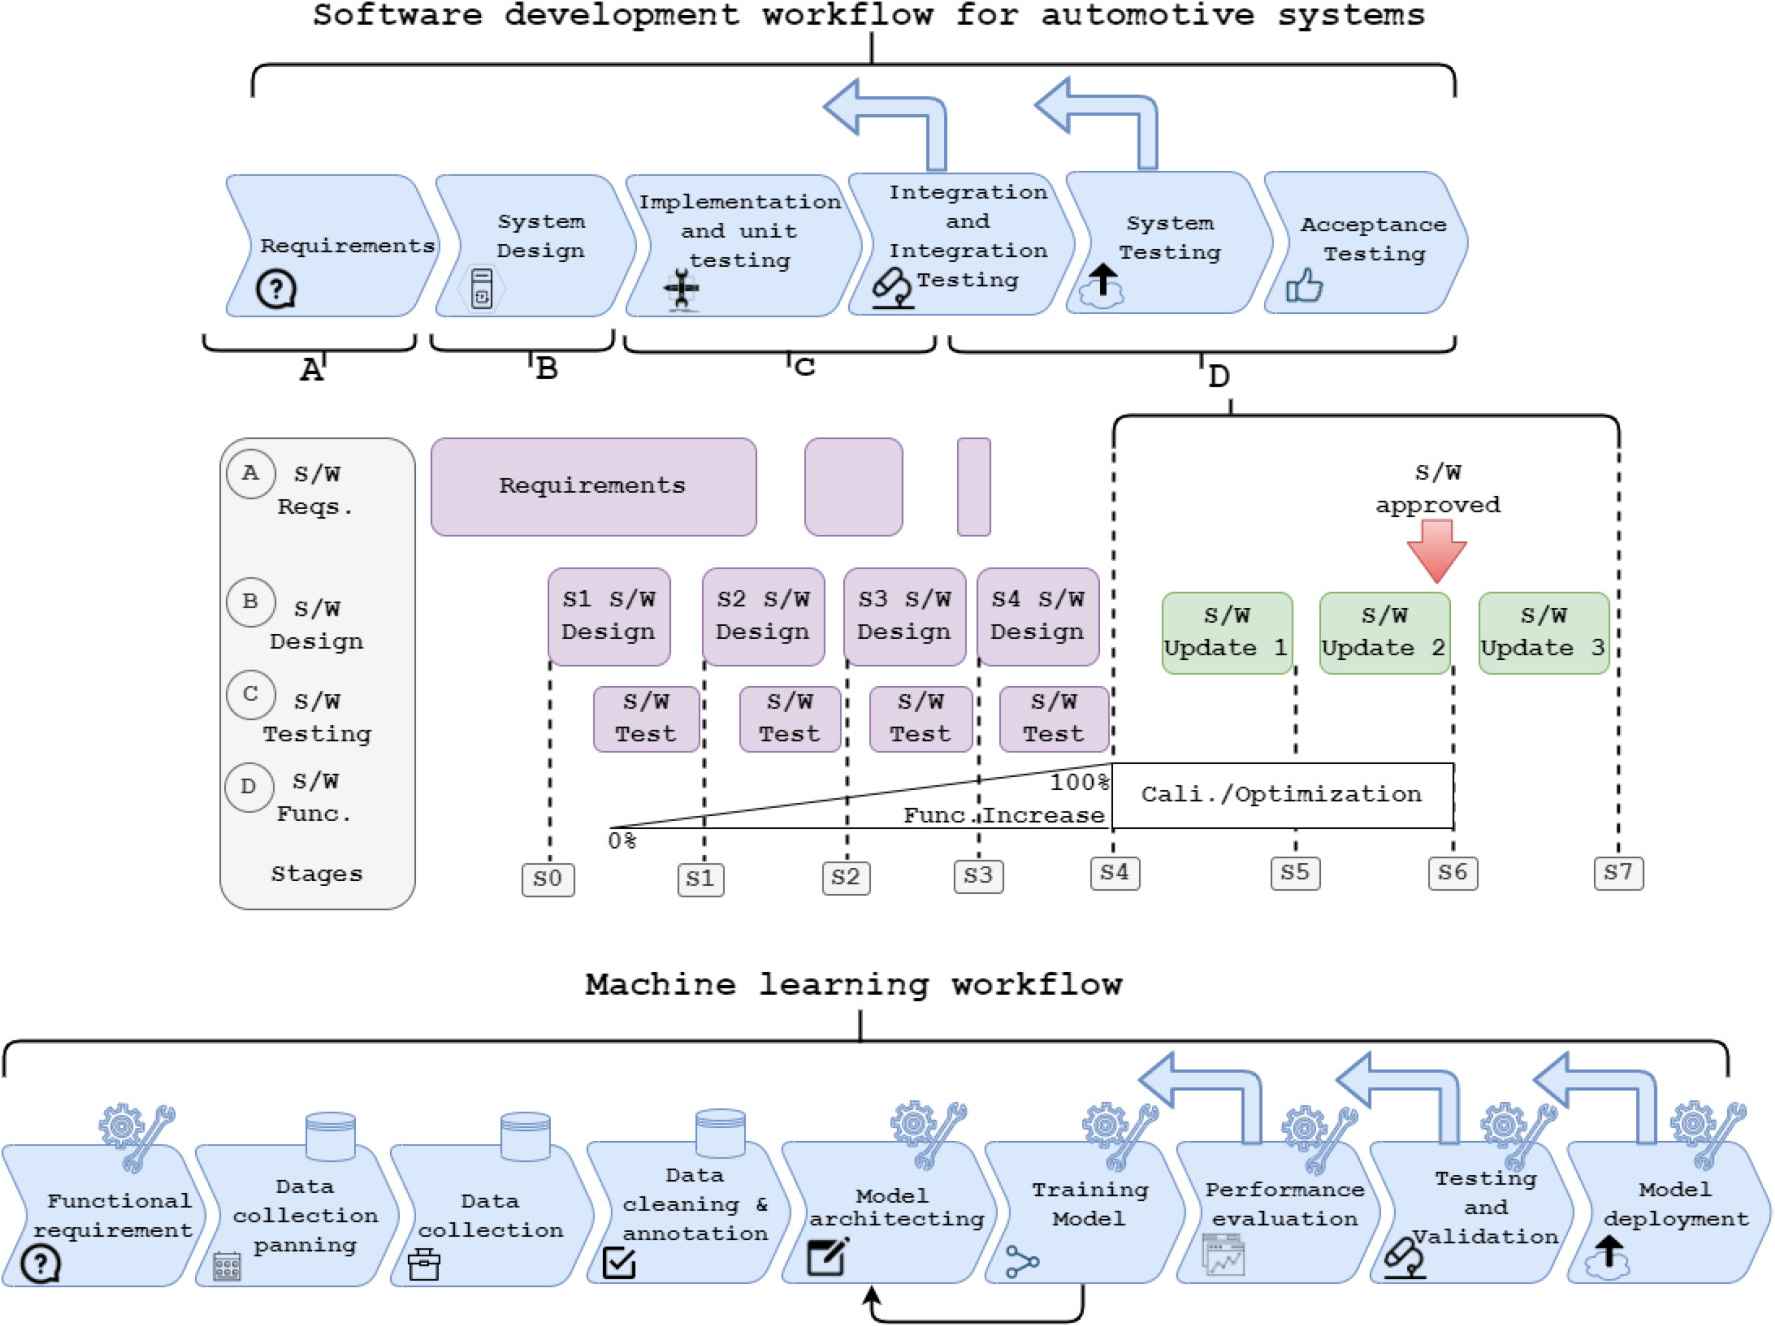
Software development workflow for automotive systems [38] and ML workflow. The top of the figure is the development phase of a software project using the V-model at the OEM. Recognizing certain overlapping processes, we’ve categorized these phases into A, B, C, and D (top of the figure). These signify the Software Requirements, Design, Testing, and Functionality stages, respectively. Now each phase is divided into small states from S1 to S7. Software testing overlaps with design, starting between S1 and S2 and continuing until S4. After S4, the system undergoes calibration and optimization, which also overlaps with the software update phases. The nine phases of ML workflow. Data collection planning, collection, cleaning & annotation are data-driven phases. Functional requirements, model architecting, training, performance evaluation, testing & validation and deployment are model-oriented. The backward arrows are the feedback from the current phase. The smaller arrow indicates training model may go back to model architecting. The bigger arrows denote the current phases that may go back to any of the previous phases. The motivation for the ML workflow is from Amershi et al. [5].
4.2. What Are the Best Practices When Combining Machine Learning Model Development With Automotive Software Development?
Figure 2 shows the two different workflows: the top figure indicates the typical workflow of software development for automotive systems, whereas the bottom figure indicates the ML-based workflow. The software development process for automotive systems at the studied OEM follows a SAFe agile development model2, which is combined with the traditional (to the automotive domain) V-model.
The automotive software development process, although iterative, still requires certain milestones – S0, S1, ..., S7 – as shown in Fig. 2. High-level requirements are often specified at the beginning of the project and refined in the course of the software development (e.g., by defining user stories to be developed per program increment and per sprint). Even testing is performed in each phase as shown in Fig. 2 and then more intensified towards the end.
The functional requirements of the ML workflow fall under the requirements phase of the V-model workflow of software development. First, there is a data collection planning phase, where requirements for data are specified, e.g., the geographical location, time of day, driving scenarios, number of data points. These requirements are then used in the data collection phase, where a dedicated team drives in a dedicated fleet of cars to collect the data to fulfill these specifications. After the data collection phase, there is a need to clean and label data, remove noise, and extract features for the ML model training phase – model architecting phase. The data collection planning and data collection phases of ML workflow falls within the system design phase of the V-model. The model architecting phase includes feature engineering and initial model selection. This phase is followed by the training phase. The training data set is inputted into the learning model of the selected architecture to train the model; there is a direct feedback loop between the training phase and the model architecting phase, to change the selected features or model if the model training metrics (or Key Performance Indicators) are not sufficient.
We found that data cleaning & annotation phase of the ML workflow falls under system design workflow of V-model. According to the study, ML model architecting, and ML model training phases of the ML workflow fall into the implementation & unit testing phase of the V-model workflow. Furthermore, the integration & integration testing phase covers the performance evaluation phase.
Figure 3 shows the process workflow for developing the ML-based vision software at the OEM who also works with different suppliers who can collect the data and/ or develop the entire ML model. The numbers (from 1 to 7) in the figure state the time the process steps takes place. If the supplier is involved, the function owner from the OEM provides the functional and non-functional product requirements (process step 1) to the development team at the OEM and its supplier company, i.e., tier 1 supplier (T1-S). The software development team, also known as the OEM team, is composed of several sub-teams that work together to develop the products. These sub-teams include the function developers, the data collection team, and the testing and validation teams. The function development team furnishes the data collection team (process step 2, from function developer to data collection team) with guidelines and requirements for data collection. Specific process steps, for instance, process step 3, are presumed to occur concurrently. Due to this reason, they share identical process step numbers. However, due to dependencies from the T1 supplier, pinpointing the sequence in which these steps occur can be challenging.
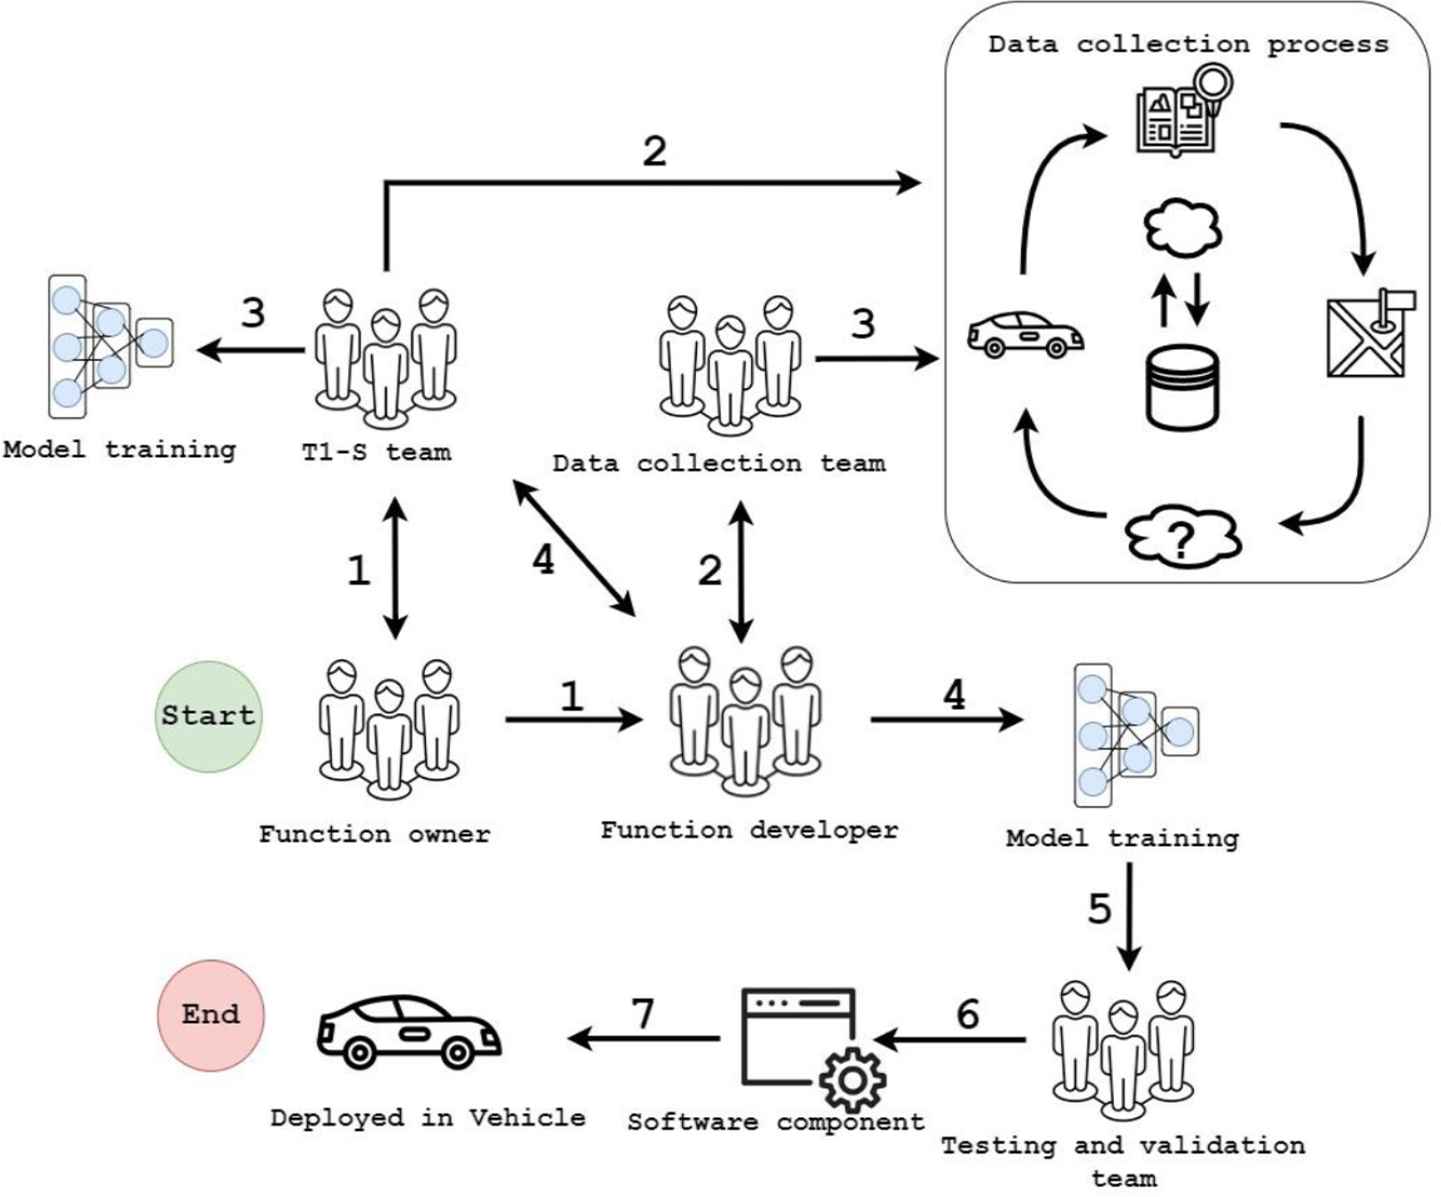
Excerpt from the ML workflow at the OEM for the studied function. The process is organized into seven steps. Note: Few of the process steps are executed simultaneously and therefore they are designated with the same process number.
T1-S can share their collected data with the software development team at the OEM (process step 4, from T1-S to function developer). T1-S trains a model using their own collected data for low-speed maneuvering. The software development team trains a new model (process step 4, from function developer to model training) using data collected by the OEM’s data collection team and also tries existing baseline methods for similar problems to understand how the ML model performs in relation to the state-of-the-art. The software development team also takes inspiration from T1-S model (process step 4, from T1-S to function developer) to increase the performance of their model. The research team at the OEM also gives feedback and suggestions to make the model more efficient and robust. After achieving the target performance, the software development team transfers the developed functions to the testing and validation team at the OEM (process step 5). Testing and validation teams perform required test cases in different environments (process step 6). After acceptance from the testing teams, the software component is deployed to the vehicle (process step 7).
Based on the interviews, we can summarize the best practices while developing such ML-based projects in Table 3, which illustrates the phases of ML-based function development, the recommended practices, rationale behind them and the related V-model or SAFe phase.
| Phase | Activity | Recommended Practice | Rationale | Fall Under V-Model Phase |
|---|---|---|---|---|
| Data collection | Planning | Plan data collection based on:
|
When planning the data collection, the software development team should explicitly state which requirements are essential for their process, i.e., how they will train their models. | System design |
| Data collection | Execution | Collecting data based on:
|
Feedback loop from the software development team to collection to adapt plans according to need. The team analyzes the data and tries to cover all possible real-life scenarios. The team will also simulate data for rare scenarios. | System design |
| Data cleaning & annotation | Organizing, removing noise, categorizing & labeling images | Examine the collected images based on:
|
Based on annotated data, the software development team analyzes all frames. There is a fixed set of scenarios defined by them for metadata. Annotated frames are passed through system generated checklist to avoid inconsistency. | System design |
| Model architecting | Feature engineering and model selection | Based on existing methods, try to focus on:
|
The function development team crops these images before the model training. They preprocess to match the training features. The team also attempted to perform experiments over existing used models using the same code base. | Implementation & unit testing |
| Training model | Training, and tuning | When training, remember to manner:
|
The software development team trains the few models in parallel and tunes the model hyperparameters. They noted the performance of each model while tuning to understand when the model performs well and where new training/data collection should be done. | Implementation & unit testing |
| Performance evaluation | Tuning and optimizing | Based on selected models, follow: select KPIs based on requirements for data and for the product performance (function performance), compare the performance using KPIs, and tune and optimize to reach the required performance. | The software development team compares the performance of different models and optimize the best one. They consult with the research team to achieve the desired performance. | Integration & integration testing |
| Testing and validation | Function testing | Keep in mind to: executing all test cases, testing of legal requirements, threshold rating, function owner’s performance requirement, and safety & security standards, and ethics | The testing team ensures compliance with safety and security standards by conducting comprehensive functional testing of the system using a variety of test cases and simulations, including rare scenarios. They rate the model’s performance based on their assessment of the functional requirements and test results. | System testing |
| Model deployment | Deployment | Model deployment focus on:
|
Deploy the developed function in testing vehicles. The testing team notes the performance in all scenarios. They prepare the report and submit it to the development team. | Acceptance testing |
Phase illustration and recommended practice.
4.3. How Is Data Collection Planned, Executed and Evaluated for Automotive Software Development?
To answer this research question, we have divided this section into two distinct subsections: data collection planning & execution, and data evaluation.
4.3.1. Data Collection Planning & Execution
The data collection process is thoroughly planned, and the data collection team has predefined guidelines for how to plan and collect the data. The team also defines the data collection goals (i.e., when the data collection can be considered as finished). The guidelines are based LSM function that needs to be developed, geographical area by the different times of the year. For instance, during winter, few places in a city, snowfall is regular, and roads are covered with dense snow, and some other types of obstacles/driving situations. Generally, such guidelines are also motivated from other developed functions. Based on these plans the driving routes are created to cover the requirements for the data to be collected for the developed function (and the required scenarios). The single team setups all the routes for the vehicles by combining requirements from different functions and teams; these teams can work on different functions – it is important to optimize the data collection process and collect data from multiple processing functions and vehicle sensors simultaneously.
Sometimes, depending on the time of the year, it may not be easy to fulfill certain requirements (e.g., collect winter data during the summer). The data collection team tries to follow the guidelines, due to the driving situations, the data collection team may decide to deviate from the plan due to the team’s safety. On the other hand, the collection team can deviate from the procedure to collect important data based on driving situation at hand, because in plan-driven, they can only cover a finite number of real-life scenarios and therefore certain degree of flexibility is needed.
The data collection phase commences when the data collection goals are achieved. One of the goals is the amount of data to be collected – measured in the number of images or number of driving scenarios, geographical locations, or other (defined by the team). Although to train a deep learning model requires a significant amount of data, it is in practice difficult – collecting of sufficient amount of data with the desired variability can be challenging. Therefore, the data collection team discusses the challenges with the software development team before and during the collection process to fulfill the data quality requirements as adequately as possible without unnecessarily postponing the software development process. The development team is responsible for requesting data recollection and stopping the data collection process. According to the development team, the following are the attributes of high-quality image data (valid for all scenarios):
- 1.
High resolution
- 2.
Annotations
- 3.
Diversity of the dataset
- 4.
Good spread
- 5.
Minimum noise
These attributes are combined with scenario-specific attributes. For example, for some scenarios it may be important to use data of varying quality to be able to assess the operational limits of the developed functions. It can be the case that the OEM also collects data with artificially aged cameras to collect blurry images, so that the function can operate even later in the vehicle’s lifecycle.
During the period of data collection the team needs to address a number of challenges. The data collection needs to cover several possible weather conditions – summer, autumn, winter and spring – which requires calendar time. Therefore, the planning needs to take into consideration which requirements are covered under which circumstances. In order to be able to introduce new scenarios, when the model training requires that, a significant amount of meta-data is collected. The meta-data contains such attributes as the geographical position, elevation, weather or time of day. It is used to filter the data when training and testing the models.
Since it is both the T1-S supplier and the OEM who collect the data, the interplay between these two teams is well-defined. In general, the OEM puts the requirements on the data collection, but for the T1-S supplier has a degree of flexibility related to both the specifics (e.g., the drivers may see a specific, interesting driving situation to capture) and technical set-up (e.g., the ability of the cameras to capture a specific situation or the need to re-capture a rare driving situation). The OEM defines true positive data, which are ranking scenarios for the Euro NCAP3.
In summary, according to interviewee E1, there exists a pre-planned approach that emphasizes adherence to guidelines for data collection, with the primary focus on data collection for scenario in which E1 work with. Occasionally, the guidelines are established by E1, while the route is determined by function owner analysis. Guidelines are formulated based on the requirements. E2 echoed similar sentiments, highlighting an organized approach with occasional spur-of-the-moment decision-making. However, E3 mentioned that the supplier team is also collecting data for the same function development.
In case when the real data cannot be collected, the teams create datasets using simulation environment and then annotate them to ensure that the model is trained properly even if real-world data is not available at the moment. To achieve the correct/required data distribution, they categorize scenarios into two sections, a) worst-case scenarios and b) best-case scenarios, as mentioned by the second interviewee (E2):
- •
So we will create data set and annotate it to get the detailed performance figures on that. And we are also looking at getting the real-life scenarios, select it as some kind of criteria, like we have some worst-case scenarios and the best-case scenarios.
Corner case scenarios are challenging to collect and handle in real life, such cases that need to be available in the data so that the model can learn from those scenarios. For example, when the bike is loaded on the moving truck, it would be confusing for the model to detect the real moving object on the road (i.e., truck, not bike). From the image-intensive system perspective, the abrupt change in lighting intensity is still rare compared to normal low-speed maneuvering driving without such changes. These corner cases are the ones that are most often simulated although, in the beginning, the team leader instructs the team members about how to collect corner case scenario.
Another scenario is the low-speed maneuvering in urban and rural areas. T1-S describes their plan for such cases, based on common space, the OEM’s software development team puts their requirements, e.g., how to drive, what to cover, etc. Otherwise, the T1-S team follows their own priorities and agenda, to optimize the overall data collection process. The third interviewee (E3) stated that:
- •
In the beginning we’ve been instructing people how to collect those kind of corner case scenarios to cover, for example, trolleys and these kind of things a bit more.
- •
So, it’s a communication part that they tell us, like, what kind of things they plan and then there is a common space where we put the requirements on them, like how to drive, what to cover and so on.
4.3.2. Data Evaluation
Function development team mainly ensures the quality of collected, and annotated datasets, i.e., when the data is being prepared for the training/test/validation processes. To ensure data quality, the development team analyzes one frame per second, and then based on the metadata, they identify the relevant samples for both the training, test and evaluation data. In this stage, the metadata about the geolocations, time of day, etc. is only one parameter, other parameters can be such metadata as status of the vehicle, e.g., sudden brake when reversing. T1-S employed software, the name of which remains confidential due to a non-disclosure agreement, to index these frames. Following this, a framework was applied to execute the indexed frames, serving as a curation framework to assess these frames’ quality, and then they perform active learning [39] to ensure it.
There is a manual review of sample frames, which is performed by a different (independent) team (X team). Before the data is indexed into an internal database they perform automatic checks for the metadata, such as, calibration correctness, GPS positioning accuracy, etc. Both the development team and team X assess the quality of data obtained from various sensors. For instance, if the camera’s positioning is incorrect due to any reason, the corresponding data is unusable and discarded. The function development team also aggregates all logs during each session of data collection. T1-S also analyzes each log, which is a long, but necessary process to ensure data quality and ultimately the product quality. The development team inspects/analyze and discusses the model performance and KPI reports regularly to ensure data quality. This information helps to identify missing information in the data set. Finally, the development team mainly focuses on the missing scenarios, so the team could achieve high accuracy prediction results. The development team defines the required prediction performance.
To annotate data, the development team selects each frame in such a manner, so that they can get the best match between cameras [40,41] and LiDAR4 (Light Detection and Ranging) sweep. It is the one of the best way for annotation [42,43] and for any camera tooling activities. The frames that are indexed into internal database. Similarly, for T1-S, there is another database and the T1-S has a curation framework, which runs over these frames.
In addition to the predefined data requirements, the both T1-S team and function development teams use active learning to ensure that the quality of the data set is as optimal as possible. The score generated by the active training model for each frame is noted, based on the scores, each scenario works on the metadata, and then frames are annotated based on scenarios.
Next is the data splitting into train/test/validation process, which is executed by selecting the frames in the distribution to match the project definition for the annotation. For example, for the camera the function development team defined that they want to have the majority of the frames from the scenarios when the drivers in the vehicle marked that they are close to the obstacle. These frames are considered in the first place due to their importance for safety testing. However, if there are insufficient number frames for the scenarios in the project, then they use frames of different scenarios, for example, dense city (when the vehicle was driving through a highly populated area). They define different countable scenarios in the project and follow their priority order, For example, 1) when driving close to the obstacles, 2) driving in a dense city, i.e., driving in a highly populated area. The final definition of curation scenario allows them to set the ratios of each scenario they wanted to get, and they will possibly never get perfect ratios because they have a finite number of frames with given meta-data attributes, but that is expected.
In the context of software development in such projects, metadata can be used to describe individual frames of data, with specific details depending on the project in question. For instance, in the case of semantic segmentation, each pixel in a frame is labeled with a class, and different classes may have different attributes and parameters depending on the types of objects present in the frame. If a particular class is not available, each object in the frame must be tested independently for semantic segmentation and object detection. This level of detail allows the development team to accurately analyze and annotate the data, enabling them to create more effective algorithms and models for their project.
They also consider the vehicle with or without a rider. For example, a bike can be just standing on the side of a road, or someone can be riding a bike (making it a vulnerable road user), these are considered different attributes or parameters of the same class. They had an automatic tool for day/night lighting and weather conditions, which help to create different weather conditions for a given instance; they also annotate those created instances. First interviewee (E1) during interview mentioned that:
- •
So, we have the semantic segmentation when we annotate the per pixel level each class. And we have the object detection, so nothing special there. But there is a plenty of classes and each of those classes have plenty of parameters.
The segmentation network can recognize a number of areas, e.g., drivable surface, vulnerable road users. To ensure the data quality, they analyze different numbers of vulnerable & non-vulnerable objects, types of cars, and all these are in the train set.
Industrial recommended practice and rationale for data collection planning, data collection, and data cleaning & annotation are shown in the first three rows of Table 3.
Summary: The data collection process was thoroughly planned based on the function requirements. The guidelines for data collection are also based on weather conditions, geographical locations, and other obstacles and even spontaneous actions (to capture specific situations). Quality of the data is ensured by two teams – one at the OEM and one at the T1-S supplier.
4.4. How Is Data Splitting Defined in Order to Assure Production Quality?
Data splitting plays a crucial role in training ML models. It prevents overfitting, aids in monitoring performance, fine-tuning, ensuring stability, robustness, and other essential aspects of the model. Therefore, it plays a crucial role to build an AI-based system in general, and in the automotive software in particular. The major challenge in the automotive image analysis is that the data needs to be split based on its metadata (e.g., geo-location) and based on image similarity (e.g., highways are very similar regardless where the image is taken). The metadata for the collected data contains several salient pieces of information about the data. Function developers exploit this information for function development. The collected metadata contains for instance (but is not limited to), information about weather conditions, time of the year, sun elevation, geographical location, road conditions, traffic conditions, etc. They also considered annotations (semantic segmentation and object detection) as metadata.
During the interview, E1 stated their approach to covering feature distribution by incorporating proxy features. However, E2 expressed difficulty in achieving optimal results when splitting data based on classes. Additionally, E3 noted that due to varying geolocations, time periods, and other factors, there exist multiple methods to effectively separate, train, and evaluate data.
E1 conveyed that their data lacks a comprehensive spread and does not cover all scenarios; hence they often rely on metadata. They ensure quality assurance through post-annotation checks and camera quality at a fixed pixel level. To enhance data quality, they actively communicate with suppliers. In order to measure the quality of data, E1 employs KPIs. E2 mentioned that sparse data in their training process, along with varying annotations for different classes, posed several challenges, such as imbalanced classes, overfitting, and difficulty in selecting relevant features. E3 highlighted their usage of segmentation networks for some scenarios, where the data mostly comprises roads with no objects. To ensure better distribution, they mentioned that they need to focus on analyzing vulnerable objects and applying sampling methods. Similar to E1, E3 also employs KPIs to measure data quality.
Regarding data sampling, E1 mentioned their splitting approach based on classes, vulnerable vehicles, and applying frame-based splitting. They also utilize meta-data for this purpose. E2 provided little information on this topic. At the same time, E3 mentioned their use of curation frameworks and T1-S using a tool for it.
The data collection team covers as many scenarios as possible in the train set. The developer team splits their dataset into training and evaluation sets based on metadata to have the same distributions of features (e.g., availability of the same objects or geolocation). For instance, the team splits the data based on geographical location. This split prevents the situation when they have images from completely different geographical locations in the training set (e.g. snowy mountain regions) compared to the evaluation set (e.g., summer setting with open lands), which can affect the performance of the model and evaluation results.
Although there is no calculation of image similarity on the pixel level, the geolocation is used as a proxy for the image similarity measurements. The assumption is that the images from different times or locations are different. The data is also complemented with proxy features to meet the real scenarios in the data, by defining grids for data quality. Time and geolocation are the proxy features; they are the features of the data (images) that are used as proxies for calculating image similarities.
One specific aspect of data splitting, which is important for production-grade ML software is the reduction (or complete removal) of data leaks. A data leak [44] is considered when the same (or equivalent) data point is used both in the training and in the test/validation data set. According to Schutt et al. [45], a model can be at risk of producing the data leak problem at any point in time. A developer can build a model that works well in a “clean” dataset, but will completely fail when applied to a real-world situation. Our first interviewee stated:
- •
Our definition was a proxy for the actual data leak. How else would you prevent the data leak from the like machine learning meaning? We need to have an image similarity model which would, try to prevent the actual leak, because we work with the vision data.
The OEM team defines data leak in terms of time, geo-location, driving situation and image similarity. The data leaks when similar frames in the training set were used for the evaluation of the model – e.g., consecutive frames from a sequence of images. Image similarity measure [46] can automatically calculate the presence of data leakage. But image similarity would be different for different functions, so they rely on visual perception. Therefore, time and geolocation are added to the images as a proxy feature to tackle data leak. A dedicated tool has been developed for that purpose.
To verify the scenarios in the similar images, OEM team also conducted experiments based on image embedding. They wanted to train a model for a specific task and extract the embedding of the images. To find similarity between scenarios such as, 1) a car at the bus station, 2) another car at a different bus station. So the embedding vector of these two images should be close to each other in an n-dimensional feature space. They also consider the concept of information leak, such as during the night, there are fewer types of particular objects, and during the day, there are more objects of another type.
Summary: The OEM team performs data splitting to meet the requirements and all possible scenarios. The team also adds a few proxy features in the train set to add rare scenarios. They split the data into train and validation sets based on multiple criteria. They also consider the concept of data leak and information leak.
4.5. What Characterizes a Good Architecture of the ML Model for Such Systems?
This RQ reports the model selection, training, and evaluation process. We organize them into three sub-research queries that address the model’s selection, training process, and evaluation in terms of key performance indicators (KPI).
4.5.1. How Is the Model Architecture Defined?
The first objective is to train a small and fast learning model in order to understand the limitations of the data. The function development team and T1-S both design their first models as small and simple. They attempt to perform experiments on previously used models (if possible), using the same code base. To increase the accuracy of the models another team member from the OEM experiments on other state-of-the-art architectures. They observed that the impact of data is higher than the architecture. The team has also observed that the order in which datasets are used in the training process can lead to different results.
The team compares all models based on performance and minimizes the deep learning network [47,48] (number of layers, number of nodes, parameters, etc.) in order to ensure that it can be used effectively on computationally limited resources in the car [49]. After analyzing all the deep learning network architectures, they list all types of suggestions to pursue. While evaluating the networks, they eventually fine-tune the different hyperparameters based on performance and easiness of the training process. Our first interviewee stated about model architecture and training process in the interview are:
- •
But the first approach was just to use whatever we have there in the zoo. How we know that the neural network architecture is good for the particular task? We know that there is no better thing? For the image size, batch sizes for training and so on, that was something we have tuned ourselves.
There are several challenges that the software development team faces while developing the entire system. For instance, the image is often defined in terms of certain questions e.g., “the object properly visible”, “how far the object is”, “what is the field of view”. The capturing cameras are also limited in the number of pixels, capturing objects fairly accurately up to a certain distance. The team precisely defined the size of the input image.
Our recommended practice and rationale for model architecting are shown in the fourth row of Table 3.
Summary: Both OEM and the T1-S start with a simple and fast-learning model. Initially, they employ NN and deep NN, then they perform the fine-tuning process. Simultaneously, another team at the OEM conduct experiments on baseline methods and different state-of-the architectures for comparison. The networks are then minimized in terms of number of layers, parameters, and nodes in order to ensure that they can be executed on limited computing resources in vehicles.
4.5.2. How Is the Training Process Defined?
The objective of this sub-RQ is to explore various aspects of the training process for the development of the vision perception system, as perceived by both the OEM and T1-S. E1 interviewee state that, it is recommended to utilize established baseline neural network models to extract embeddings of objects. E2 mentioned that T1-S additionally trained a parallel model using their collected data on various environments: they also helped in the tuning and training process in multiple environments. They performed fine-tuning it for optimal performance through weight and bias optimization. They also meticulously adjusted the hyperparameters of different models. E3 stated that, it is crucial to explore state-of-the-art architectures that aim to minimize the number of parameters while still achieving optimal results. Additionally, both E1 and E3 said that the training from scratch may require significant manual work and never-ending training, which can be mitigated by employing parallel model training and continuous feedback with the research team. Our third interviewee mentioned the following about training process:
- •
When it comes to the from scratch training of the networks, it’s a lot of manual work finding the best things there. And there are methods to kind of try where you can do an automatic optimization where there are optimizers and where there are parameters and number of epochs and so on.
The OEM finished the training based on evaluating loss function and the KPIs. The OEM uses a specialized internal tool to assess predefined performance levels based on hyperparameters. This tool evaluates trained models, but we can’t disclose its name due to confidentiality agreements. If the team wants to test over internal tool, then they predefined number epochs and investigate the values of the loss function. If the loss converges and KPIs stabilize, then they stop the training. When they have intersection over union loss [50], they pre-train the model based on defined pre-training objectives.
When they apply KPIs to stop training, then the training stops earlier or too late. For instance, when loss converges and KPIs become stable, it saves some epochs and system energy. However, the training process never ends if they set specific KPIs goals, which they never reach. Our third interviewee stated about role of KPIs:
- •
You could use KPIs even for stopping the training, but then it’s a bit tricky, because you can either stop earlier or stop too late. So, if you train for example, and then you measure KPIs and let’s say you converge quickly with good enough KPIs, then maybe you can save some epochs and some energy in the system, so you don’t train.
- •
But it could be also that if you target certain KPIs and you never reach that goal then you can run endlessly. So, you need to have another stop criteria somewhere.
To avoid such challenges and achieve the most optimal KPIs, they designed another stopping criterion based on what system they develop. For instance, if they train a network, but the data is from other scenarios, then the training process is limited. It is limited because these data are collected for some other missions and can have different environments/geolocations, etc. They also consider the scenarios of one place, such as high traffic, which cannot guarantee that the scenario works for another area with a similar traffic scenario. Although new samples of data enhance the model, which can improve the model’s performance, it can also make the training process a long and iterative one.
The information from the model training is fed back to the model architecture stage to test the influence of the architecture as shown in Fig. 2. Our third interviewee commented over training feedback during the interview:
- •
The information from the training fed back to the model architecture stage? If it influences the model architecture? It is actually. We just recently changed one thing when it comes to, for example, the encoders.
Industrial recommended practice and rationale for training a model phase is shown in the fifth row of Table 3.
Summary: The team trains the network from scratch based on a lot of manual work. T1-S supports by optimizing weights and bias values. They also help in the training of the model in multiple environments. OEM team also performs a lot of manual work to analyze the training process. When the loss converges and KPIs become stable, they stop the training.
4.5.3. How to Quantify the Model’s Performance in Training, Testing, and Validation During the Production Quality of ML-Based Systems?
Performance evaluation constitutes a fundamental stage within the ML-workflow, as depicted in Fig. 2. Prior to requesting additional data collection, it is advisable by E1 to first assess the model’s performance using three levels of KPIs at the detection level. These KPIs can be used to test the model’s efficacy for further improvement. These KPIs are: 1) pixel-level evaluation, 2) feature-level evaluation based on projection onto the occupancy grid, and 3) sensor fusion-based evaluation encompassing the entire system function. Our first, second, and third interviewees, respectively stated regarding KPIs and performance evaluation:
- •
So, you know there’s like 3 levels of KPI’s measurements at least. I mean the first one is on the pixel level, second one is on the projection to the occupancy grid, measurement or whatever, and the third one is after the sensor fusion.
- •
We as a team focus on functional KPIs or we just focus on the algorithm KPIs. We only work with perception.
- •
It could be an issue if we for example look at the object detections. So, let’s say that we would like to have very high performance on the humans, we care less about high performance on the cars.
On the measurement grid, the focus lies on optimizing the predictive performance of emergency braking post-sensor fusion. The KPIs are continuously tracked at every stage, beginning with pixel-based evaluation. Specific functions are required to operate accurately within a virtual environment. In case of deteriorating KPIs in subsequent model iterations, the software development team engages in a comprehensive analysis of the entire process to identify the root cause. This may involve scrutinizing sensor data, examining sensor fusion, or investigating camera data. The OEM has multiple teams dedicated to performance evaluation and root cause analysis, which collaborate to enhance the model’s overall performance.
E2 stated that, to achieve detailed performance evaluation, a data set should be created with annotations based on KPIs and model stability. The team can then determine desired performance levels based on rating scenarios. During data design and dataset creation, the development team defines various KPIs. For example, they establish true positive sets that assess the model’s performance in detecting target dummies when a car navigates on the track. Interventions in these sets are carried out to create rare scenarios that are prerecorded. However, such scenarios are not included in the training set to prevent data leakage. Additionally, KPIs are designed for other types of object detection, such as detecting humans versus cars in the images. In such cases, the performance is split into intersection over union (IoU) over different objects. Finally, E3 mentioned that the model should be evaluated based on various parameters, such as network size, image size, stable KPIs, and the root cause of any issues should be traced back to losses and KPIs. Training performance should be tracked to ensure optimal results. We recommend a specific set of practices during the performance evaluation and testing & validation phases, which are detailed in the sixth and seventh rows of Table 3.
Summary: The team organizes KPIs at three levels, i.e., pixel level, occupancy grid level and sensor fusion level. They measure IoU for pixel-based, then KPIs for simulation environment and to minimize false positive rate. They backtrack all the phases in case when they identify the poor performance of the model. They have different teams to examine the model’s performance based on different level of KPIs. They focus on the true positive rate for when the car drives in the target dummy’s track and prerecorded scenarios.
5. DISCUSSION
Our investigation has revealed that automotive software development incorporating ML is considerably more complex than that of desktop software or operating systems. Contrary to previous studies, such as Amhersi et al. [5] research at Microsoft, our findings indicate that the focus is on data collection from the field and the subsequent model development phases. The studied company places substantial emphasis on planning data collection from the perspective of data quality, e.g., to prevent data leaks. This is unlike other companies, which often resort to designing their own data split algorithms after the fact. During the data collection phase, a concentrated effort should be made to achieve the driving scenario objective, while simultaneously encompassing all possible scenarios and image quality. Particular attention should be devoted to corner cases, as they may require special handling to ensure the safety of the vehicle, its occupants, and the surrounding environment.
We have established a correlation between the phases of the SAFe process and the ML-workflow, as indicated in the final column of Table 3. Our observations indicate that the system design phase encompasses data collection and planning, as well as data cleaning and annotation. Similarly, the implementation and unit testing phases pertain to model architecture design and performance evaluation. Moreover, the system testing and acceptance testing phases are associated with testing and validation, and model deployment, respectively. Our findings align with those of Falcini et al. [51], as previously reported.
Given the ongoing development stage of the LSM function, we cannot address post-deployment considerations at this point. Our study should have covered this aspect, which is crucial for adapting machine learning systems. We cannot comment whether the interviewed team applied post-deployment measures to the LSM function. Future research could explore strategies for managing post-deployment changes in ML-based automotive functions to enhance sustained performance understanding.
Based on our research, we recommend a systematic approach to model development. First, the development team should create a simple and concise model and then optimize it accordingly. Alternatively, they can explore existing solutions that minimize the risk of unexpected behavior and reduce the effort required for model testing, validation, and deployment. During the training phase, the team should monitor data quality, in particular, rare case scenarios and data leakage, by tracking suitable KPIs to measure progress (e.g., Staron et al. [52]). In addition to standard ML testing and validation, the team should also perform software test cases, legal requirements, and safety and security tests. Our findings align with previous research by Salay et al. [2] and Rabe et al. [53].
6. VALIDITY EVALUATION
This section will discuss the potential threats and vulnerabilities in our study’s design, methodology, and findings. By identifying and addressing these potential threats, we aim to enhance the credibility and reliability of our research outcomes.
Internal validity
One potential internal threat to validity is the possibility of selection bias. There are four participants in our study were all involved in the development process of image-intensive systems, which may limit the generalizability of our findings to other domains. Additionally, the sample size was relatively small, which could affect the representativeness of our results. Furthermore, the interviews were conducted by a single interviewer, which may introduce interviewer bias, and the interviewees’ behavior and mood during the interview could also influence the results. Finally, there may be inconsistencies in the coding process, which could affect the accuracy and consistency of our results.
External validity
External validity refers to the extent to which the findings of this study can be generalized to other settings, populations, or contexts. To mitigate this, we may need to collect data from a larger and more diverse sample of engineers working on similar projects. Additionally, we should consider conducting the study in other organizations to examine the generalizability of the findings. To address potential bias, we could also consider using multiple methods of data collection and analysis. To ensure that the study’s findings accurately reflect the perspectives and experiences of the participants, we should engage in member checking, which involves sharing the study’s results with the engineers who were interviewed and asked for their feedback on the accuracy and completeness of the findings.
Furthermore, our study focused on developing and evaluating the low-speed maneuvering function using fisheye cameras. However, we need to consider how the hardware, platform, and software are integrated into the automotive system. This could impact the function’s real-world performance due to practical challenges introduced by hardware integration. Not having specific questions about hardware integration is a limitation of our study. Our findings mainly relate to the function’s development and effectiveness in terms of software and algorithms. However, smooth hardware integration is crucial for successful real-world deployment, which our study should have thoroughly addressed. Future research could delve into dedicated inquiries about hardware integration to improve the broader understanding of such a function’s implementation challenges. This would provide a more comprehensive view of the function’s function in practical scenarios.
Construct validity
Maintaining construct validity is crucial for ensuring that a study accurately measures the intended constructs and concepts. In our study, we focused on the development of ML-based vision perception systems for active safety in an automotive OEM, we took several measures to strengthen the construct validity of our research. First, we carefully selected and operationalized the variables based on established theoretical frameworks and expert opinions. Second, we conducted pretesting of our measures to assess their clarity and effectiveness. Finally, we conducted thematic coding and shared it with group members to ensure consistency and reliability. By following these steps, we are confident that our study accurately measures the relevant constructs and provides a strong foundation for our analyses.
Conclusion validity
Conclusion validity is crucial for ensuring that the conclusions of a study are based on sound data and analysis. However, our study is limited by the fact that we only collected data from one team at the OEM. This restricts the generalizability of our findings, and to strengthen the validity of our conclusions, we recommend incorporating data from other sources, such as archival data, observations, or interviews with additional stakeholders involved in the development process. By doing so, we can enhance the validity of our conclusions and ensure that they accurately reflect the broader context of the study.
A limitation stems from the case study’s constrained size and scope. Although our study provides valuable insights into developing and evaluating the low-speed maneuvering function using fisheye cameras within a specific context, directly extrapolating these findings to broader scenarios could be challenging. The case study’s focused nature might limit the function’s applicability to different deployment contexts and diverse hardware configurations. Further research involving larger and more varied scenarios is necessary to enhance the generalizability of such function’s outcomes.
Our study’s results may affect its applicability in different project phases and Technology Readiness Levels in a combined process. We acknowledge this limitation in our study’s scope and conclusions.
7. CONCLUSION AND FUTURE WORK
Machine learning takes increasingly more place in automotive software development, as increasingly more functions use machine learning algorithms. One of the areas is vision perception systems, where static images or video feeds are used to identify obstacles. However, the use of these algorithms requires changes in automotive software development processes.
In this article, we studied the process of developing a vision perception system for one of the features of the SAE level 3 autonomy. The challenge in developing this system is the use of dedicated cameras, which are common in the automotive systems, but not well- supported in machine learning research (image recognition, object detection, semantic segmentations).
In this study, we found that the SAFe automotive development process can be aligned with the machine learning development process. We also found that the development team should always involve in the data collection phase, as it is the most important phase in the development process. The team should also focus on the model development phase, as it is the most time-consuming phase.
Our study also revealed a meticulous data collection process guided by functional requirements and real-world conditions. The quality of the collected data is vital for the subsequent stages of development. Collaborative efforts between different teams and ML models impact the overall assurance of production quality. Additionally, considerations of data leak problems reflect the comprehensive strategy and over-all product quality. Our study highlights a careful data collection process driven by functional needs and real-world scenarios, indicating its role in subsequent development stages. The collaboration between various teams and machine learning models profoundly influences overall production quality assurance. Moreover, different teams also look for data leak issues that can affect the overall product quality. Our study’s limitations include the number of interviewees and involved customers. It offers an illustrative example of integrating development processes within a specific context, providing valuable insights from this limited scope.
While our study offers valuable insights, its scope is confined to four interviewees from a single OEM, impacting generalizability. Therefore, in future work, we plan to collect and integrate diverse data sources – like archival records, observations, and interviews with varied companies to provide a more comprehensive context for our findings. We also plan to conduct similar interviews in other development projects of multiple OEMs to ensure product quality. We also plan to conduct interviews and discussions over the testing process, production model finalization, and data quality during run time. Furthermore, we plan to explore the evolution of the combined process during deployment/utilization and its adaptability across various Technology Readiness Levels, providing deeper insights into its dynamics and versatility across diverse project contexts.
Acknowledgment
The authors would like to thank the interviewees for their time, input and validation of the findings.
Conflict of Interest
The authors declare that they have no conflicts of interest.
Data Availability
The interview transcripts data supporting the findings of this study are available from Volvo Cars Corporation. However, we are unable to share them due to a non-disclosure agreement.
Funding
This study was funded by Vinnova, FFI, Fordonsstrategisk forskning och innovation (Grant Number 2018-02725).
Authors’ Contribution
Sushant Kumar Pandey: Research Design and Planning, Data Analysis, Writing – Original Draft, Writing – Review & Editing, and Visualization.
Vasilii Mosin: Participant Selection, Interview conducting, Review & Editing.
Darko Durisic: Supervision, Research Design and Planning, Review & Editing.
Ashok Chaitanya Koppisetty: Supervision, Research Design and Planning, Review & Editing.
Miroslaw Staron: Supervision, Research Design and Planning, Writing – Review & Editing, and Visualization.
Footnotes
SAE is the Society of Automotive Engineers, an organization which defined five levels of autonomy of vehicles. Level 1 allows for using driver assistance systems, while level 5 allows fully autonomous vehicles without drivers. Level 3 allows conditional driving automation.
REFERENCES
Cite This Article
TY  - JOUR
AU  - Sushant Kumar Pandey
AU  - Vasilii Mosin
AU  - Darko Durisic
AU  - Ashok Chaitanya Koppisetty
AU  - Miroslaw Staron
PY  - 2023
DA  - 2023/10/18
TI  - Data Handling for Assuring Production Quality of Image Intensive Autonomous Drive Systems: An Industrial Case Study
JO  - Journal of Software Engineering for Autonomous Systems
SP  - 29
EP  - 47
VL  - 1
IS  - 1-2
SN  - 2949-9372
UR  - https://doi.org/10.55060/j.jseas.231018.001
DO  - https://doi.org/10.55060/j.jseas.231018.001
ID  - Pandey 2023
ER  -


