
Revised 26 July 2023
Accepted 29 September 2023
Available Online 29 November 2023
- DOI
- https://doi.org/10.55060/s.atmps.231115.012
- Keywords
- Bones
Wild boar
Yield (fatigue) strength
Ultimate bending strength
Ellipse
Superellipse - Abstract
The bones of vertebrates differ in many ways. When we consider the internal structure of bones, some have slender marrow cavities and relatively thick walls, while others are built oppositely. Previous studies looked for the biomechanical optimum of the long bones using a circular model of the cross-section at the mid-length of the bone. This study proposes new models based on the ellipse, which more closely approximate the actual shape of the cross-sections. The derived models are compared with a small sample of the cross-sections of a wild boar's limb bones (humerus, femur). Finally, the shape of the cross-sections involving the ellipses, superellipses and superpolygons is discussed.
- Copyright
- © 2023 The Authors. Published by Athena International Publishing B.V.
- Open Access
- This is an open access article distributed under the CC BY-NC 4.0 license (https://creativecommons.org/licenses/by-nc/4.0/).
1. INTRODUCTION
After leaving the aquatic environment, terrestrial vertebrates had to evolve body structures that maintained their body shape in conditions with much less ambient pressure. The long bones carrying the weight of the whole body must be adequately solid and rigid. At the same time, they should show only a minimum bend or torsion when forces usually acting on them are applied.
For the sake of simplicity, long bones are treated as hollow tubes usually filled with bone marrow [1,2,3]. The long bone's properties depend mainly on the structure and distribution of the material they consist of [2]. The relative importance of the outer (cortex) and inner (marrow) part may differ on a large scale. Some bones possess a thin cortex and a large marrow cavity, others a thick cortex with a small amount of marrow. The bones of the limbs must withstand loads that act on the bone cross-sections. The cross-sectional shape of the bone as well as the thickness of the wall depend on the distance from the end of the bone and the orientation of the acting forces.
Galileo Galilei was the first who noticed that hollow tubes have the advantage of resisting bending forces compared to a full profile filled with the same material [4]. This advantage can be expressed by the ratio of the second moment of the area of the cross-section (I) to the area of the cross-section (A), which is in the case of the fully filled tube:
Limb bones are liable to fail by fatigue, due to stresses imposed repeatedly or can be broken if the maximum of bone strength was exceeded [9]. The bone cross-sectional arrangement, therefore, corresponds to the mechanical load regimes to which the bones are usually subjected [10].
Currey was concerned with the question of how thin the thin-walled bones should be to withstand local buckling. Calculations made by him took only the mass of cortical bone into account. The bones seemed to be too thick-walled, although the investigated skeletons were roughly minimum mass structures [11]. Currey & Alexander took into consideration also the mass of marrow and produced calculations for the optimum hollowness of long bones. Theoretical calculations were compared with measurements on more than 240 long bones from 70 species of animals. They discussed the thickness of the bone's wall and concluded that a 10 % saving in the mass of the bones, compared with a solid bone, would produce a 5 % saving in the power required for fast galloping. They consider this saving as essential in terms of natural selection [12]. Évinger presented that human femora are optimized to withstand bending, fracture, or yield and fatigue strengths [6].
The cross-sectional dimensions of the bones determine their ability to withstand the stresses created by forces acting on the bones. The cross-sectional shape may indicate the usual type of loading. Cross-sections that have a more circular shape are suitable for multidirectional load modes, while the elliptical shape refers to unilateral loading [13].
Available studies in the field [5,6,14,15,16] evaluate the strength of bones according to the article [12] by Currey & Alexander, who focused on the bending of the bones and calculated the optimum thickness of the bone's walls. They considered the long bones as circular ones in the cross-section.
The subject of this article is the assessment of the construction of the long bone's cross-sections in terms of bending. The aim is also to consider the real (mostly elliptical) shape of the cross-sections of the long bones. The revised mathematical models are going to be compared with experimental data found in long bones of wild boars.
2. ELLIPTICAL CROSS-SECTIONAL MODEL OF THE LONG BONES
Let:
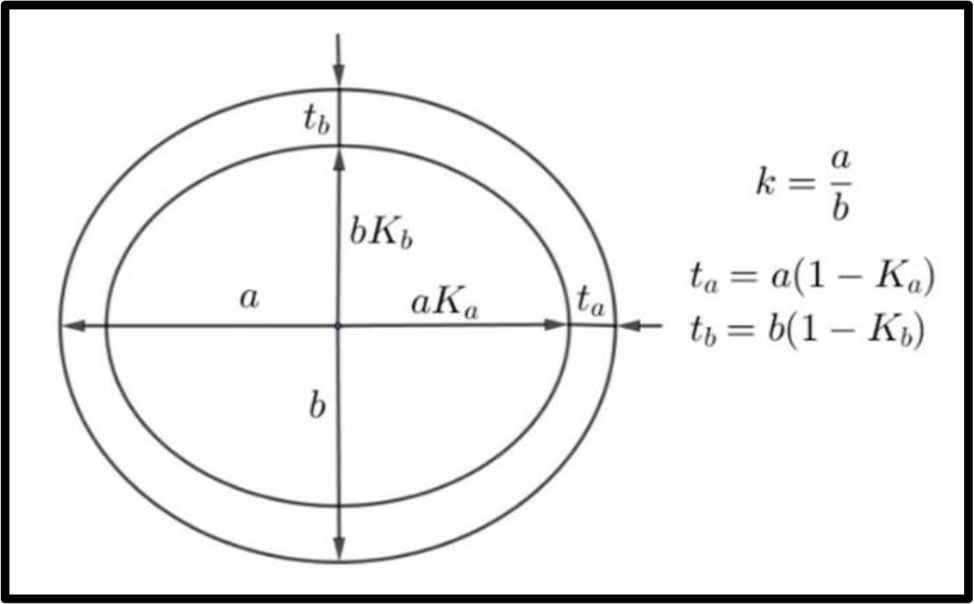
Conventions for a, b, Ka, Kb, k, ta, tb used in text.
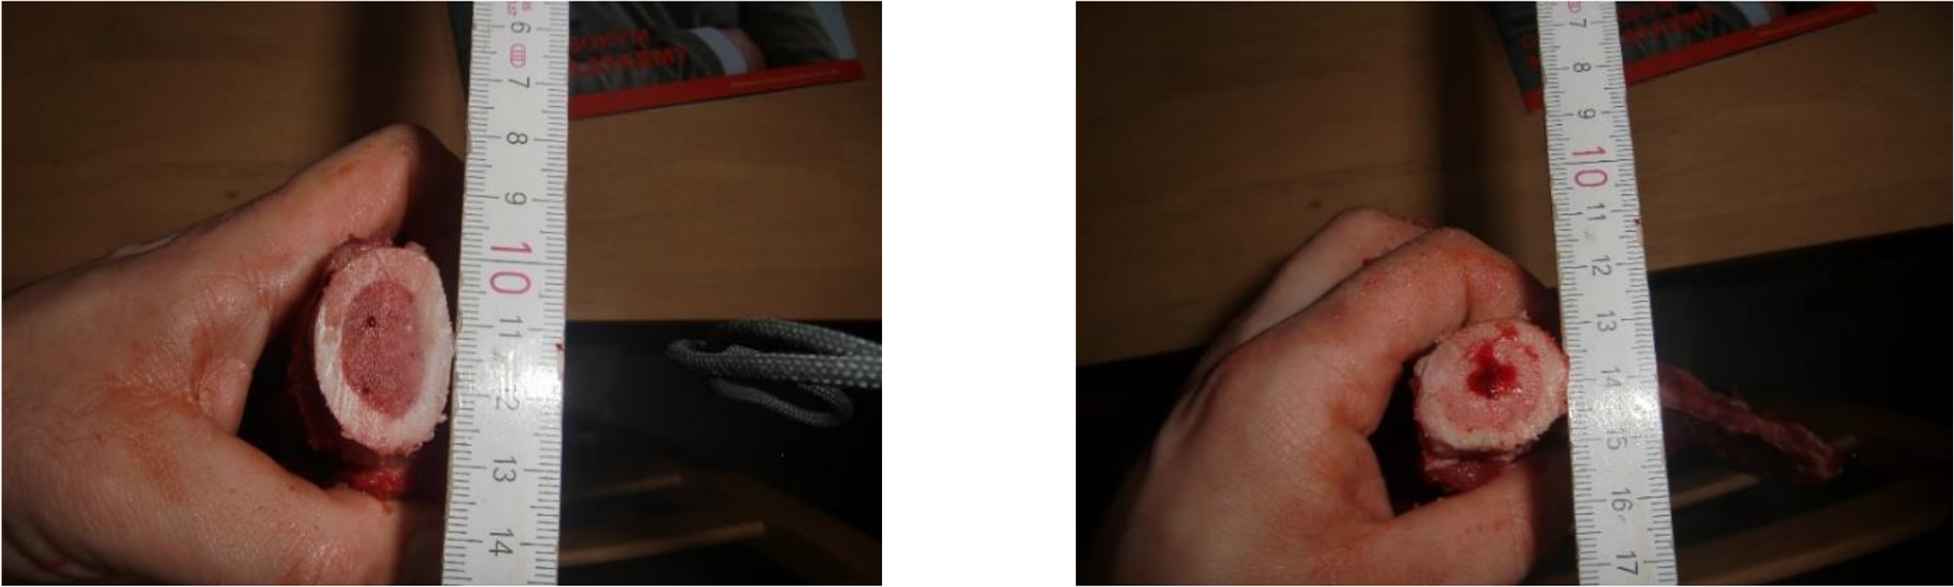
The cross-section at mid-length of the humerus (left) and femur (right) of a wild boar (male, weight approx. 70 kg, age approx. 3 years).
Currey & Alexander determined several requirements for the optimum value of K (circular cross-section, Ka = Kb). The bone must be strong enough [12]:
- •
not to yield, under the greatest bending moments likely to act on it;
- •
not to fail by fatigue, under the bending moments expected to act repeatedly on it;
- •
not to fracture under the greatest bending moments likely to act on it.
2.1. Yield (Fatigue) Strength in Bending
The stress produced by some bending moment M must not exceed some critical value σcrit. Considering the second moment of the area relative to the minor semi-axis of
If the density of bone relative to the unit of length is equal to ρb (and in the case of marrow ρbm), then assuming the smallest possible radius of the major semi-axis of a, the mass of the bone segment per unit length is:
The mass of the bone changes as the values of the quantities of Ka, Kb change. The mass of the bone tends to zero when the values of Ka, Kb tend towards 1. In other words, the same strength of the bone could be achieved by an increase in diameter accompanied by lowering the thickness of the wall [12].
The optimal values of Ka, Kb can be found (if they exist) as a minimum of a multivariate function given by Eq. (1) via evaluating the partial derivatives (∂m/∂Ka, ∂m/∂Kb) and solving a system of equations:
The procedure mentioned above will also be used when looking for the optimal values of Ka, Kb in the next section.
2.2. Ultimate Bending Strength
When evaluating the ultimate bending strength, the first moment of the area of the half cross-section about the diameter would need a particular value to withstand a particular bending moment. With respect to the first moment of area of the semi-ellipse about the minor semi-axis of
3. PRELIMINARY VERIFICATION OF BOTH MODELS ON A SAMPLE OF WILD BOAR'S LIMB BONES
This article proposes a new elliptical model for calculating the optimum thickness of the limb bone's walls. This section aims to make a comparison of the assembled models with a small sample of wild boar's limb bones.
The humeri and femora of 5 adult wild boars were gathered. The length of each bone was measured, and 2 diameters, mutually at right angles, halfway along its length. The bone was sectioned at mid-length, and the internal diameters corresponding to the externally measured diameters were measured using the caliper [12]. The choice of bone center results from the relatively regular shape, while the bending stress in the center of the bone is probably the largest [10]. Each bone produced two values, both Ka and Kb. In three cases, a specimen of about 5 cm in length was detached to determine the average density of a solid bone and of marrow.
Wild boars’ body mass was in the range 60–75 kg.3 The length of the humeri varied in the range 17–23 cm, and the cross-sections at mid-length were elliptical with the ratio of a/b in the range 1.34–1.47:1. The length of the femora varied in the range 18–23 cm, and the cross-sections at mid-length were elliptical with the ratio of a/b in the range 1.21–1.38:1 (Table 1). When determining the Ka and Kb values, gender was not considered. The values of the density of marrow and solid bone are given in Table 2.
| a | b | ta | tb | Ka | Kb | |
|---|---|---|---|---|---|---|
| Humeri | 13.0 – 15.3 | 9.6 – 11.6 | 4.6 – 5.4 | 4.0 – 5.1 | 0.62 – 0.66 | 0.54 – 0.61 |
| Femora | 11.5 – 13.0 | 9.3 – 11.2 | 4.4 – 5.4 | 3.2 – 4.9 | 0.58 – 0.66 | 0.54 – 0.70 |
Humeri and femora of wild boars; the conventions for a, b, ta, tb, Ka, Kb are in Fig. 1 (lengths given in mm).
| Solid Bone | Marrow | ρbm/ρb | |
|---|---|---|---|
| Wild Boar | 2070 | 860 | 0.42 |
The average density (kg/m3) of a solid bone (ρb) and marrow (ρbm) of wild boars.
3.1. Yield (Fatigue) Strength in Bending
Eq. (1) with respect to the ratio ρbm/ρb (Table 2) can be modified to the form:
The evaluation of the partial derivatives (∂m/∂Ka, ∂m/∂Kb) of Eq. (3) gives the system of equations:
So far, the values of Ka, Kb have been treated as independent quantities. This assumption does not seem to be justified, because bones are complex structures, and their mechanical properties should answer their inside design. From this point of view, it might be useful to think about Ka, Kb as dependent quantities and introduce a new variable:
The formulas for Ka, Kb are of the form (Fig. 3):
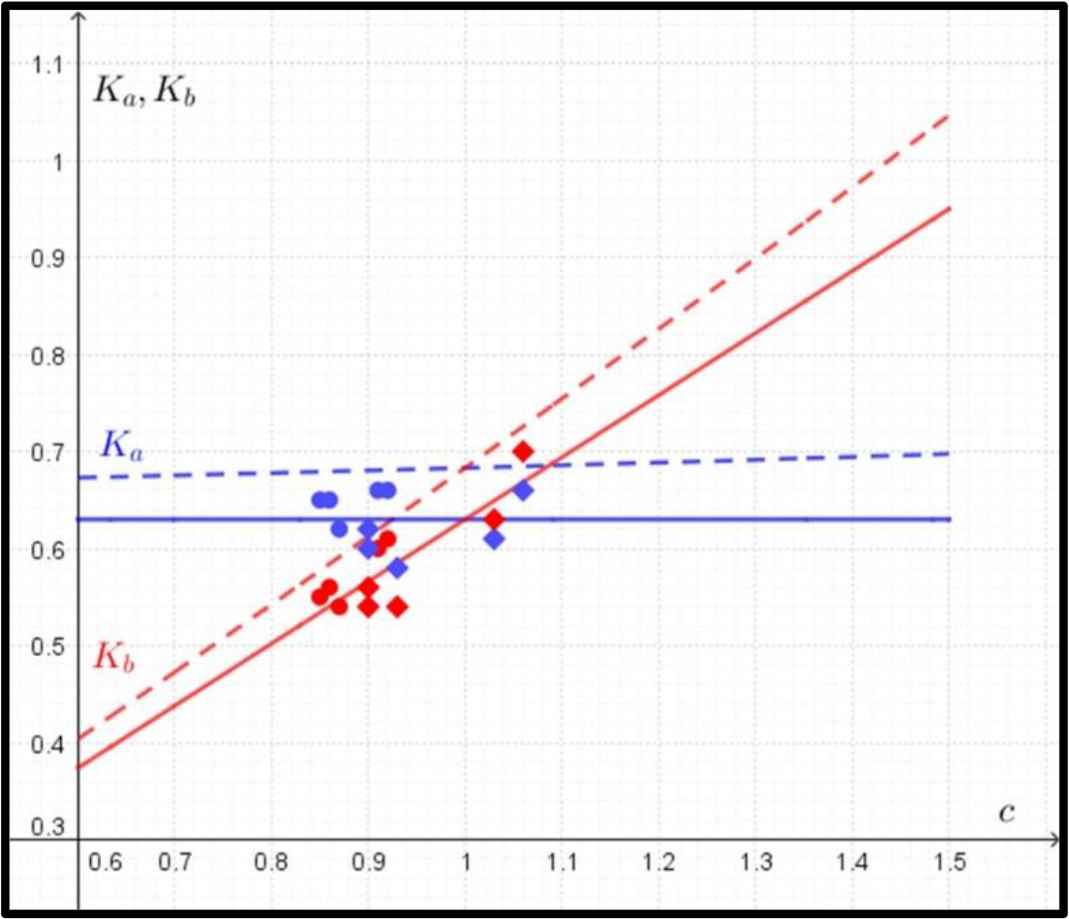
Comparison between predicted and observed data in the case of yield (fatigue) strength. The predicted data for Ka (in blue) and Kb (in red) according to Eq. (4) are marked with dashed lines, and the observed data for Ka (in blue) and Kb (in red) are marked with circles (humeri) and rhombuses (femora). The regression lines for observed values of Ka and Kb are marked with solid lines.
In the case of the circular shape of the cross-section, where K = Ka = Kb, the evaluation of the derivative of Eq. (3) gives the single value of K = 0.68.
3.2. Ultimate Bending Strength
Eq. (2) with respect to the ratio ρbm/ρb (Table 2) can be modified to the form:
Using the same procedure as in the previous section leads to the equation:
Thus the formulas for Ka, Kb are of the form (Fig. 4):
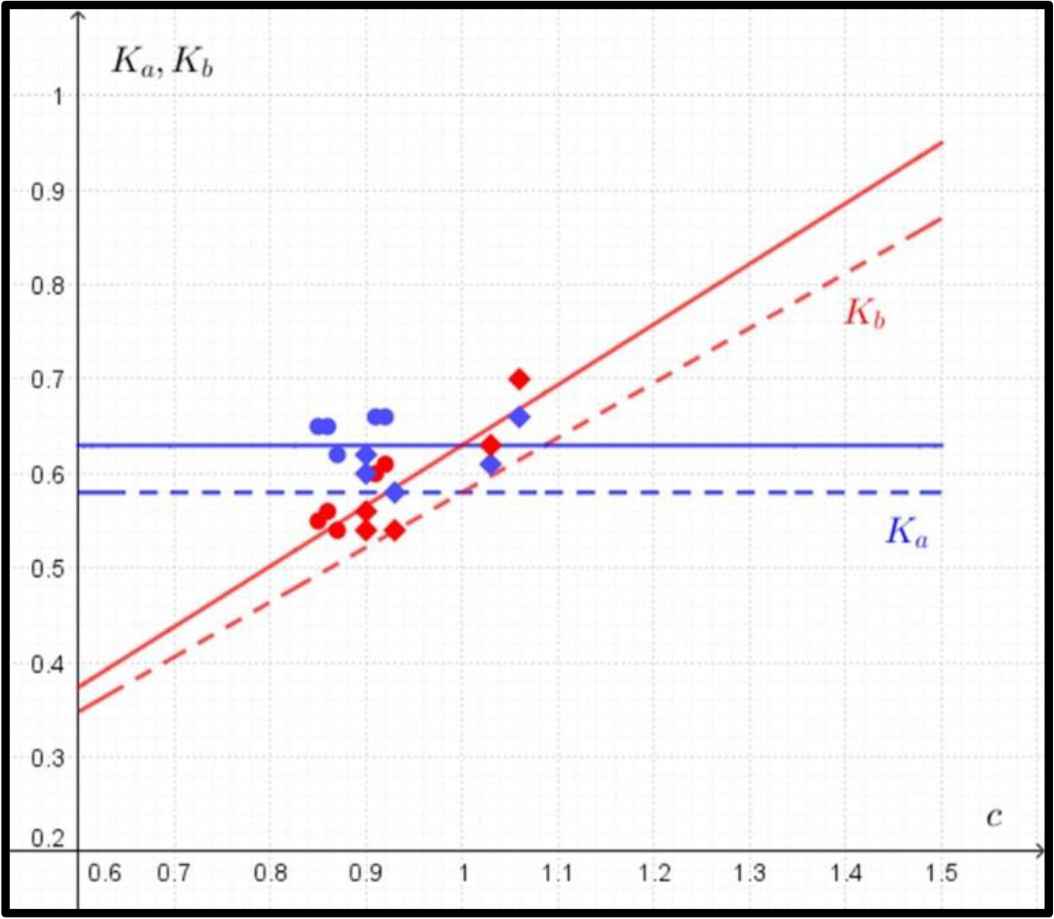
Comparison between predicted and observed data in the case of ultimate bending strength. The predicted data for Ka (in blue) and Kb (in red) according to Eq. (4) are marked with dashed lines, and the observed data for Ka (in blue) and Kb (in red) are marked with circles (humeri) and rhombuses (femora). The regression lines for observed values of Ka and Kb are marked with solid lines.
4. DISCUSSION
In the case of yield (fatigue) strength, the function of the mass of the bone does not have a single optimal value (a minimum) of Ka and Kb. Therefore, the quantity of Ka was determined as a function of the ratio of c = Kb/Ka. As the value of the ratio c increases, the mathematical model predicts a slow increase in the value of Ka and a sharp increase in the value of Kb (Fig. 3).
The mathematical model describing the ultimate bending strength does not show any dependence on the ratio of c in the value of Ka (Fig. 4) and predicts a sharp increase in the value of Kb.
When comparing the observed data with the predicted ones, one can see that the elliptical model could be a suitable alternative to the circular model, especially after verifying a larger sample of the cross-sections. Such verifying might also answer the question of whether the limb bones are built preferably for yield (fatigue) strength or ultimate bending strength.
The elliptical models also predict the substantial saving in the bone mass of wild boars (Fig. 5). The potential saving in a mass of bones is expressed as a function of c = Kb/Ka, where:
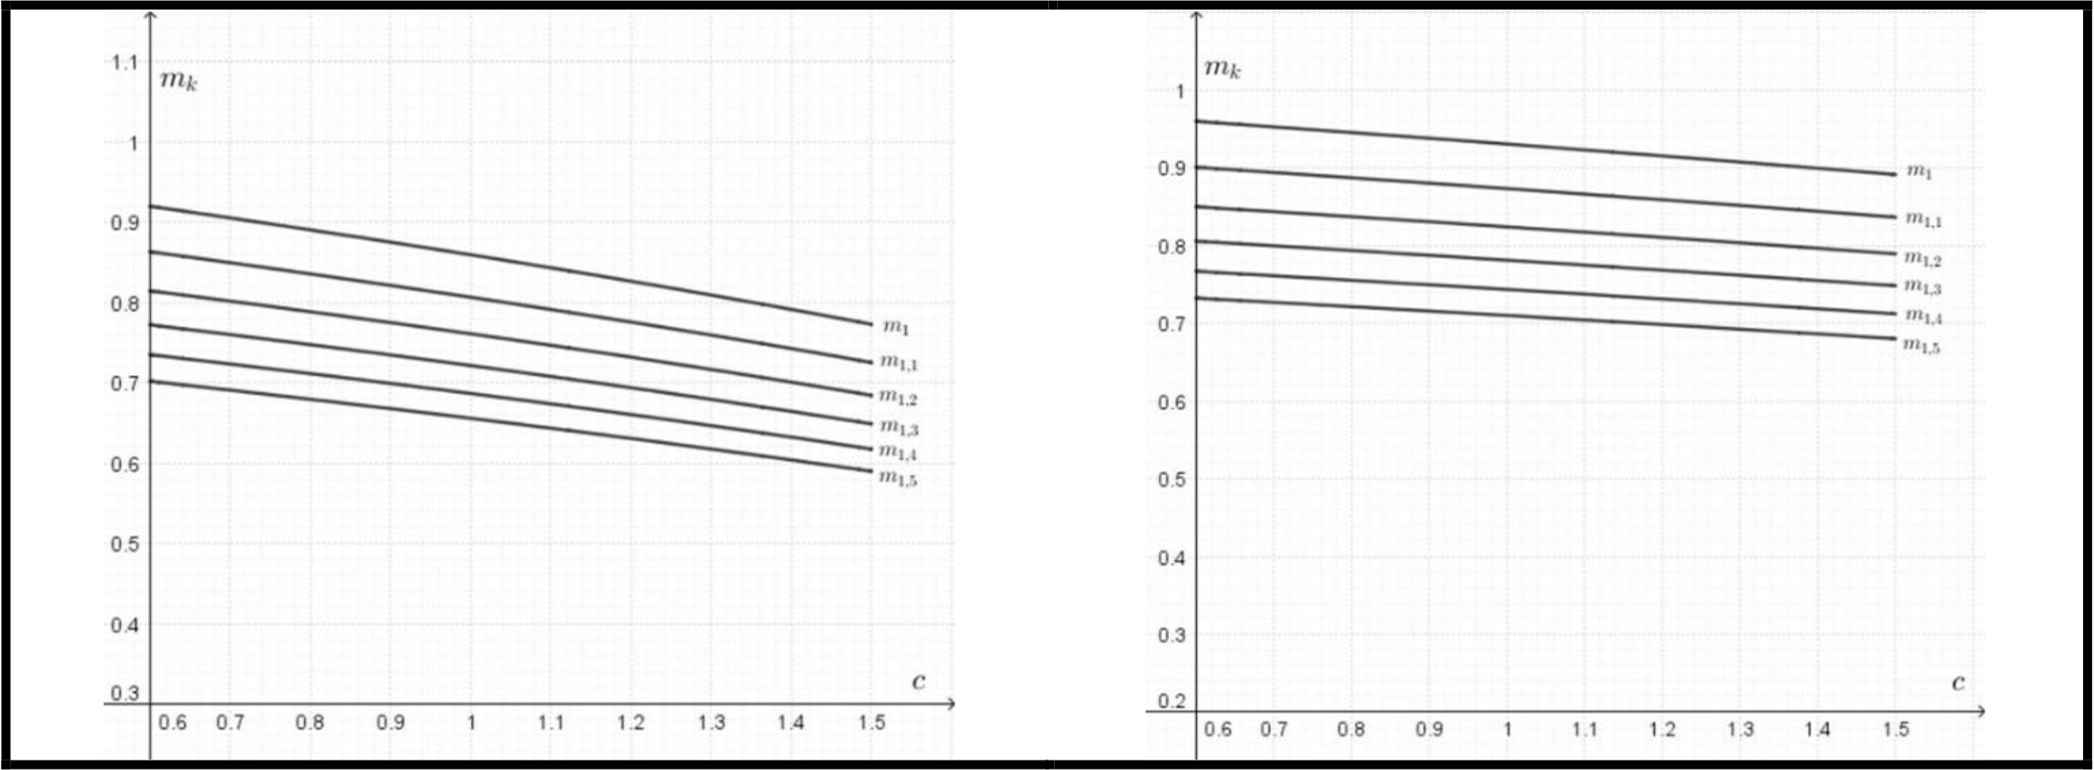
Left: the potential saving of the bone mass (mk) for different values of k = a/b as a function of c= Kb/Ka for yield (fatigue) strength according to Eq. (7). Right: the potential saving of the bone mass (mk) for different values of k = a/b as a function of c = Kb/Ka for ultimate bending strength according to Eq. (8).
This saving of material occurring in less stressed parts could be considered as more important than the optimum wall thickness, which does not differ significantly from the typical values for circular cross-sections.
5. CONCLUSION
Limb bones (not only) of wild boars are predominantly elliptical in cross-section at mid-length, with the major axis usually oriented in the direction of movement of the animal. This arrangement can increase the bending strength in the sagittal plane by reducing the bending stress [17]. The femoral cross-sections are generally less eccentric when compared to the humeral. Amson & Kolb in [18] report that large-sized deer have a significantly more elliptical (less circular) femoral cross-section at mid-length than smaller bodied cervids.
Kilbourne & Hoffman [7] state that in quadrupedal mammals, the forelimbs typically support 60% of the total body weight. Higher loading of the forelegs may explain both the greater eccentricity of the cross-sections of the humeri and the higher proportion of cortical bone in the cross-sectional area. The construction of humeri on the cross-sections indicates the predominant unilateral stress acting on these bones and, consequently, the forelegs. Both the smaller eccentricity of the humeri and the decreasing proportion of bone to the cross-sectional area (with the growing value of the radius, typically for elderly individuals) suggest that the humeri are usually loaded in more directions.
The observed values of K (Ka, Kb) varied in the range 0.54–0.70. Currey & Alexander [12] report a range of quantity of K = 0.4–0.7, which they consider being optimal. Bernáth et al. [5] assessed the thickness of the fox femora (Vulpes vulpes L.). The observed values of K were in the range 0.59–0.74, with an average value of K = 0.68. De Margerie et al. [14] examined the values of K for the long bones of wings and legs of 22 bird species and found the values of K in the range 0.41–0.85. Suhai et al. [16] examined the values of K for humeri, femora, and tibiotarsi in crows (Corvus cornix L.) and magpies (Pica pica L.). An interesting conclusion was finding almost the same values of K = 0.77–0.79 for both gas- and marrow-filled bones. Demes et al. [15] investigated the long bones (humerus, femur) of primates from the family Indriidae. They found that the K-values vary in a broad range of values with lower ones in the case of humeri. More massive femora are associated with a different way of primate movement when the hind legs are more heavily loaded. We can conclude that the observed values of K corresponded to the previous surveys.
Currey & Alexander [12] report using the circular model a saving in mass of bone in the value of about 13 %. The elliptic model does not predict a single value of savings but considers both the ratio of major axis lengths and the ratio of K. From this point of view, the model predicts an increasing value of bone mass savings for an increasing value of c = Kb/Ka.
Both yield (fatigue) and ultimate bending strength mentioned and calculated in the article were based on the usage of the ellipse. One can easily find that the real shape of the cross-sections (humeri, femora) differs more or less from the ellipse. Spichal [19] showed that the models based on the ellipse and the single superellipse do not fit the shape of the cross-section of the long bones with sufficient precision. The model of the compound superellipse calculating the shape for four quarters of the cross-section was built. The static methods used confirmed the performance of the compound superellipse model.
Very similar observations were also made in the case of tree stem cross-sections, and the superellipses were reported as suitable models for calculating the cross-sectional areas [20]. Finally, we can mention the observation made by Mattheck et al. [21], which indicates some similarity between the failure resistance of animal limb bones, and trees with an internal cavity. Studies that have been done on a large sample of trees show that the possibility of failure of the tree suddenly increases at a ratio of 70 % hollowness.
Footnotes
We assume that the bone is loaded in a pure bending, so it is exposed to the same bending moment all along the bone [2].
All applied equations assume an ideal geometric form, but bones are usually not perfectly tubular structures. On the other hand, the calculations allow us to investigate the mechanical behavior of bones [3].
The weights determined by the hunters and included in the results mean the weight of the animal after removing the internal organs. It is a common practice of hunters in the Czech Republic.
REFERENCES
Cite This Article
TY  - CONF
AU  - Luděk Spíchal
PY  - 2023
DA  - 2023/11/29
TI  - The Shape of the Cross-Section and the Strength of the Long Bones
BT  - Proceedings of the 1st International Symposium on Square Bamboos and the Geometree (ISSBG 2022)
PB  - Athena Publishing
SP  - 143
EP  - 152
SN  - 2949-9429
UR  - https://doi.org/10.55060/s.atmps.231115.012
DO  - https://doi.org/10.55060/s.atmps.231115.012
ID  - Spíchal2023
ER  -


